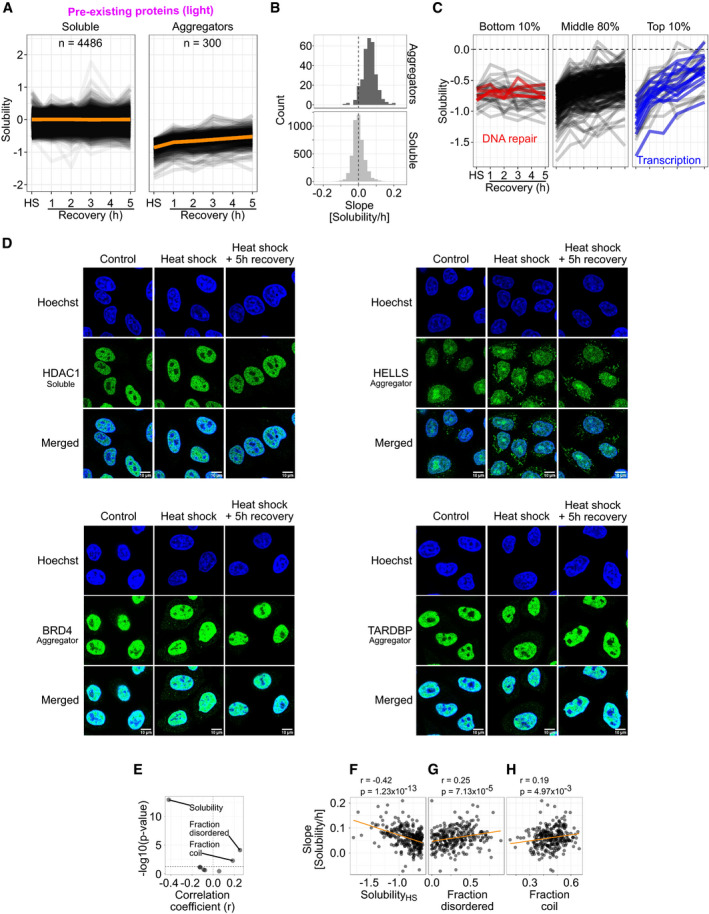
Figure 3. Disaggregation of aggregated proteins during recovery from heat shock.

-
ALine graphs showing solubility after heat shock (HS) and during different time points of recovery. Each line corresponds to one protein. Orange lines show the mean solubility.
-
BQuantification of disaggregation rates. Disaggregation rate for each protein is estimated as a slope from linear fits of data used in (A). Histograms of slopes (binwidth = 0.02 Solubility/h) are shown for aggregators and soluble proteins.
-
CDifferent disaggregation profiles for aggregating proteins. Solubility line graphs as in (A) shown for aggregators with the bottom 10%, middle 80%, and top 10% of disaggregation rates. Proteins with bottom 10% of disaggregation rates and related to DNA repair are highlighted with red. Proteins with top 10% disaggregation rates and directly related to transcription are highlighted with blue.
-
DProtein localization upon heat shock and during recovery as analyzed by immunofluorescence microscopy. HeLa cells were fixed and immunostained with antibodies against indicated target proteins (green) at different conditions [control, after heat shock (10 min at 44°C) and after 5 h of recovery from the heat shock]. DNA staining (Hoechst) is shown in blue.
-
E–HComparison of disaggregation rates with different protein characteristics enriched in aggregators (presented in Fig 2B, C, and E–G). Volcano plot presenting correlation coefficients and Benjamini–Hochberg‐adjusted P‐values (E; horizontal dashed line shows a P‐value of 0.05). Scatterplot comparing disaggregation slopes and solubility change after heat shock (F), fraction of intrinsically disordered regions (G), and fraction of (random) coil‐like secondary structure (H). In (F–H), scatterplots are shown for correlations with a P‐value lower than 0.05. Correlation coefficients (r) with P‐values are shown for Spearman's rank‐order correlation.
