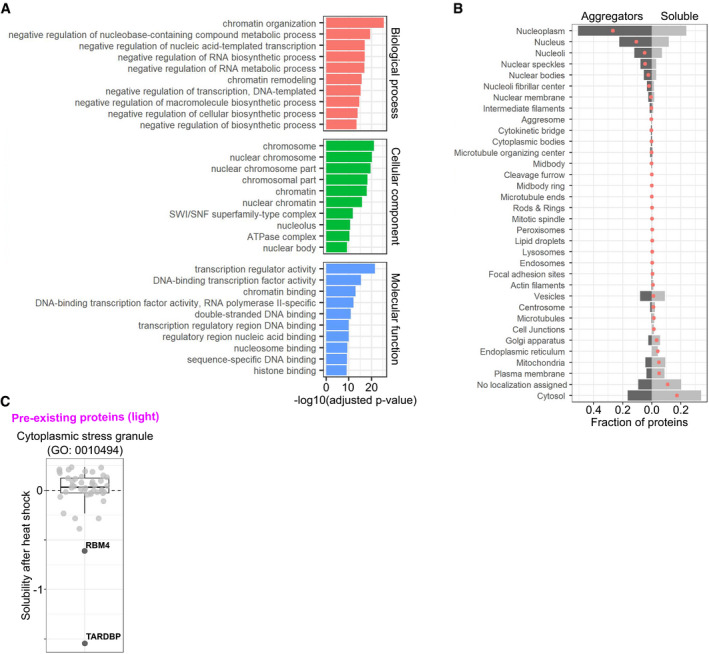
Figure EV3. Functions and localizations of aggregators and heat shock‐induced solubility changes of stress granule proteins.

- Gene ontology (GO) enrichment of aggregators. Bar plot showing 10 most enriched (lowest Benjamini–Hochberg‐adjusted P‐value in hypergeometric test) terms from each GO domain.
- Localization annotations for aggregators and soluble proteins. Bar plot showing the fraction of aggregating or soluble proteins having particular localization annotation. Red dots indicate the difference between aggregators and soluble proteins.
- Solubility changes of stress granule proteins after heat shock. Heat shock‐induced solubility changes of proteins with a GO term “cytoplasmic stress granule” (GO:0010494). Aggregators are labeled and highlighted with darker color.
Source data are available online for this figure.
