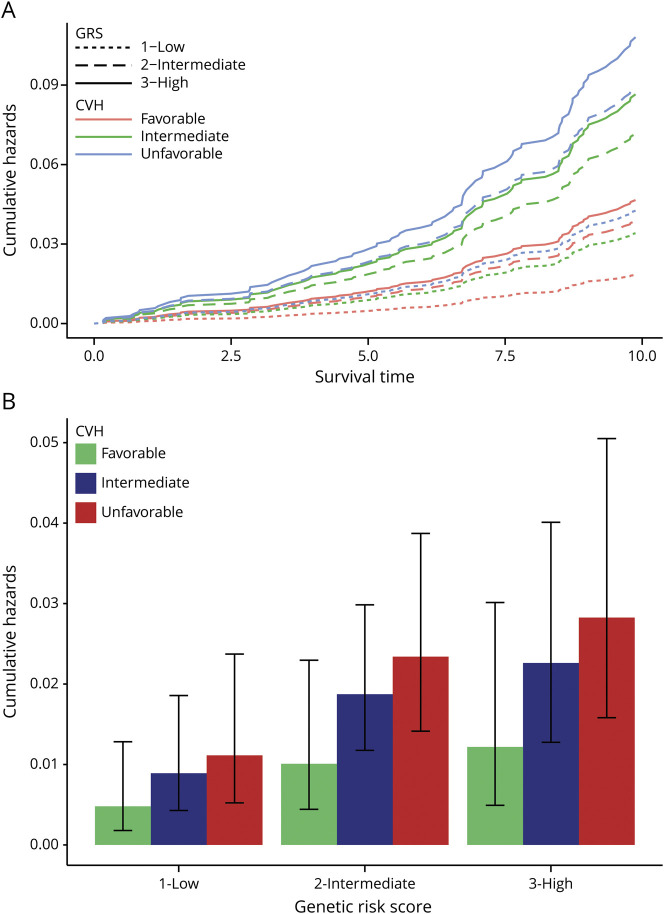
Figure 1. Hazards of dementia by GRS and CVH.
(A) Cumulative hazards of dementia over 10 years of follow-up by genetic risk score (GRS) category (1 = low [dotted line], 2 = intermediate [dashed line], and 3 = high [solid line]) and cardiovascular health (CVH) category (favorable [pink], intermediate [green], and unfavorable [blue]). (B) Cumulative hazard estimates at 5 years of follow-up (middle of maximum follow-up) by GRS and CVH. Error bars represent 95% confidence interval of estimated cumulative hazards at 5 years.

