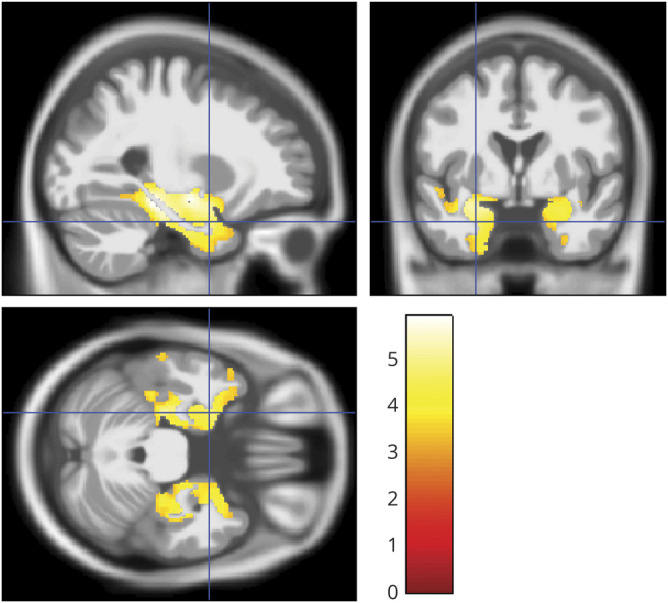
Figure 5. Entorhinal cortex neuron loss and gray matter volume.

Sagittal, coronal, and axial view (right of image is right of brain) of clusters of at least 20 voxels surpassing a significance threshold of 0.001, uncorrected for multiple comparisons, for the effect of entorhinal cortex neuron loss on gray matter volume, controlling for age, sex, total intracranial volume, and the temporal interval between MRI scan and death. The color bar in the right lower corner indicates the T values.
