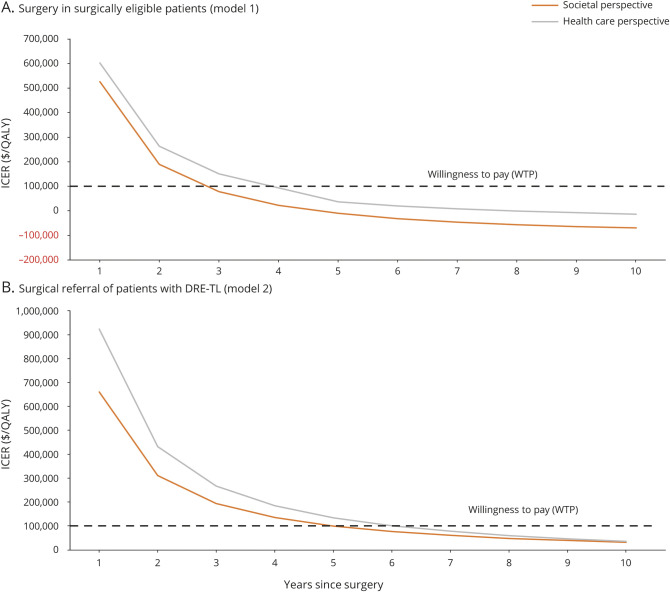
Figure 2. ICER vs time plot for surgery and referral for surgery.
(A) Curves show how the incremental cost-effectiveness ratio (ICER) varies with time from surgery in patients found eligible for surgery. (B) Curves show how the ICER varies with time from surgical referral (and possible subsequent surgery) in patients with drug-resistance temporal lobe epilepsy (DR-TLE). Results of the analysis from the societal (orange) and health care (gray) perspective are shown. Negative values of ICER occur when surgery becomes cost-saving compared to medical management. QALY = quality-adjusted life-year.

