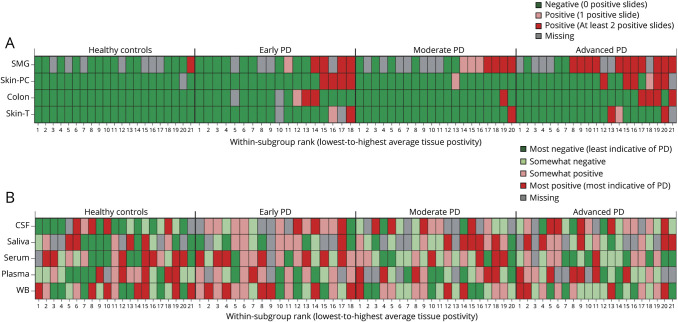
Figure 1. Heat map depicting, by subgroup, the relative degree of α-synuclein (α-Syn) positivity.
α-Syn positivity across (A) each tissue type, as defined by the number of positive slides; and (B) each biofluid, as defined using quartile scores. For CSF and serum α-Syn, rank values in the lower quartile (i.e., the lowest 25% of values) were defined as most indicative of Parkinson disease (PD), whereas for saliva, plasma, and whole blood (WB) α-Syn, rank values in the upper quartile (i.e., the highest 25% of values) were defined as most indicative of PD. For each panel, participants are sorted by subgroup in order from lowest-to-highest average tissue positivity; accordingly, each given column across the 2 panels corresponds to the same participant. PC = paravertebral cervical; SMG = submandibular gland; T = thigh.

