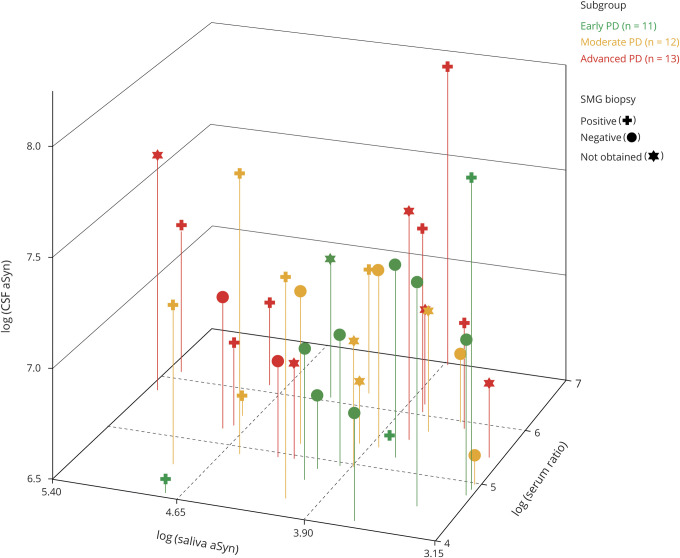
Figure 3. Scatterplot of CSF α-synuclein (α-Syn) (pg/mL) vs saliva α-Syn (pg/mL) vs the ratio of serum α-Syn (pg/mL) to serum hemoglobin (mg/dL) among patients with Parkinson disease (PD) with adequate specimens obtained for all 3 biofluids.
All values were plotted on the log scale. Each point represents a single patient with PD, with different colors and symbols indicating disease stage and submandibular gland (SMG) biopsy status.

