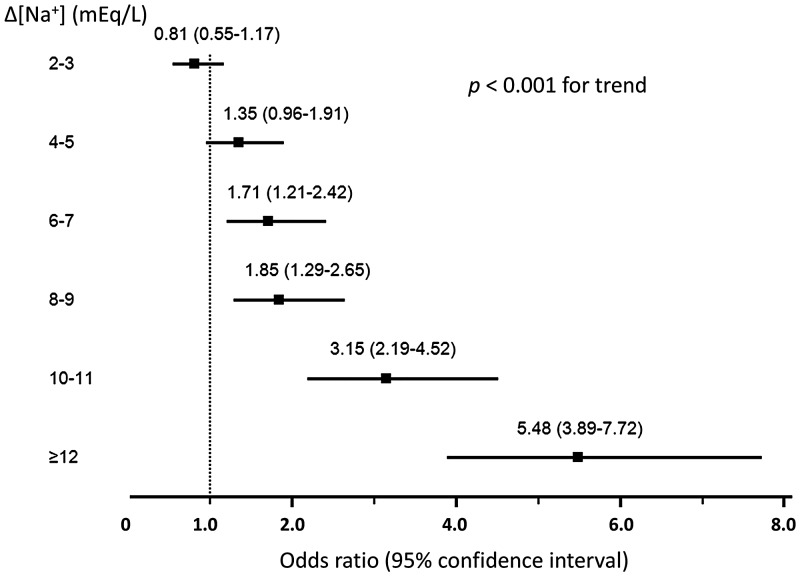
FIGURE 1.
Adjusted OR (95% CI) for hospital mortalities of the entire cohort of patients (n = 60 944) with serum [Na+] variations from 2 to ≥12 mEq/L. Adjusted for age; sex; race; principal diagnosis; CCI score; history of coronary artery disease, congestive heart failure, peripheral vascular disease, stroke, diabetes mellitus, chronic obstructive pulmonary disease and cirrhosis; eGFR; admission serum [Na+]; number of serum [Na+] measurements and length of hospital stay. x-axis: OR (95% CI) y-axis: Δ[Na+] (mEq/L) = peak serum [Na+] – nadir serum [Na+]

