ABSTRACT
Although dietary guidance recommends increasing consumption of whole grains and concurrently limiting consumption of refined and/or enriched grain foods, emerging research suggests that certain refined grains may be part of a healthy dietary pattern. A scientific expert panel was convened to review published data since the release of 2015 dietary guidance in defined areas of grain research, which included nutrient intakes, diet quality, enrichment/fortification, and associations with weight-related outcomes. Based on a 1-d roundtable discussion, the expert panel reached consensus that 1) whole grains and refined grains can make meaningful nutrient contributions to dietary patterns, 2) whole and refined grain foods contribute nutrient density, 3) fortification and enrichment of grains remain vital in delivering nutrient adequacy in the American diet, 4) there is inconclusive scientific evidence that refined grain foods are linked to overweight and obesity, and 5) gaps exist in the scientific literature with regard to grain foods and health.
Keywords: grain foods, refined grains, fortification, enrichment, dietary patterns, obesity
Summary of the Expert Panel Meeting
Table 1 lists the consensus reached during the expert panel meeting following discussions and review of published, peer-reviewed, scientific evidence. The expert panel also noted that gaps remain in the scientific literature and encouraged continued research involving grain foods within healthy dietary patterns. In addition, the expert panel noted an explicit need for additional nutrition research that distinguishes between types of grains, beyond the classification of whole and refined grains. The current grain type classification used by dietary guidance that places all grains that are not “whole grains” into one category of “refined grains” may need re-evaluation because many enriched grain foods [i.e., ready-to-eat cereals (RTECs) and breads] that are labeled as refined grains provide nutrient density to the American diet.
TABLE 1.
Consensus statements derived from an expert panel roundtable event
| 1. Grain foods make meaningful nutrient contributions to US dietary patterns. In particular, both whole and refined grain foods can play a role in helping deliver shortfall nutrients to the American population. |
| 2. Grain foods are meaningful contributors of nutrient density in the American diet in both children and adults, with particular emphasis on ready-to-eat cereals, breads, rolls, and tortillas. |
| 3. Grain foods can contribute nutrient adequacy in the US diet of children and adults. |
| 4. Currently with US typical dietary patterns, a large percentage of children and adults are not meeting recommendations set forth by authoritative dietary guidance. Removing portions or all of certain whole and refined grain foods from the diet can further exacerbate nutrient inadequacies in US children and adults. |
| 5. Removing refined grains from the diet results in more children and adults falling below recommendations for shortfall nutrients as identified by the 2015–2020 Dietary Guidelines for Americans. |
| 6. Available scientific evidence from observational studies does not support the notion that refined grain consumption is linked to increased risk of overweight and obesity. |
| 7. Limiting consumption of indulgent refined grains, due to contributions of calories, added sugar, sodium, and saturated fat, is necessary within dietary patterns. |
| 8. Evolving dietary guidance needs to evaluate emerging grain research to address the nutritional relevance of certain refined grain foods within dietary patterns. |
| 9. The current categorization of refined grain foods may need further delineation, particularly because current evidence suggests differences in nutrient contribution from breads and cereals in comparison to indulgent grain foods such as cakes, cookies, and pies. |
| 10. Future research should consider distinguishing different types of refined grain foods with the goal of potentially creating an additional classification of grains that goes beyond the terms “whole” and “refined”. For example, dietary pattern–focused research needs to separate refined grains (i.e., breads and cereals from cakes, cookies, and pies) when assessing nutrient intake, diet quality, and health-related outcomes. |
| 11. Future research should consider repeating currently available analyses with epidemiological-based databases other than NHANES. For example, the expert panel recommends conducting analyses using large cohorts, including the Nurses’ Health Study and Health Professional Follow-Up Study, in which refined grains are further distinguished (i.e., refined grain categories need to differentiate between breads and cereals and cakes, cookies, pies, etc.). |
DGA, Dietary Guidelines for Americans.
Introduction
The grain food group has been an integral part of eating patterns in American dietary practices. Whether through enrichment (i.e., replacing nutrients in the food lost during processing) and/or fortification practices (i.e., adding nutrients to the food at higher concentrations than naturally present), several grain food groups have been recognized as important contributors of energy and nutrient density in the American diet. For example, when considering dietary patterns proposed by the 2015–2020 Dietary Guidelines for Americans (DGA), both the Healthy US- and Healthy Mediterranean-Style 2000 kilocalorie patterns recommend 6 ounce equivalent (oz eq) servings of grains per day, with half of those servings being whole grains, whereas the Healthy Vegetarian eating pattern recommends 6.5 oz eq daily servings of grains, with 3.5 oz eq stemming from whole grains (1). However, the 2015–2020 DGA distinguishes between the nutritional relevance of whole grains and refined grains by assigning emphasis on greater consumption of whole grains and concurrently limiting consumption of refined grain foods. The 2015–2020 DGA carried forward recommendations from the 2010 DGA, which outlined a healthy dietary pattern being one that increases whole grain consumption by replacing refined grains with whole grains. The 2010 DGA further stated “limit the consumption of refined grains, especially refined grains containing added sugar, sodium and solid fats” (2). Although certain grain foods may contain higher concentrations of nutrients to limit, including added sugar, saturated fat, and sodium, many grain foods, including whole and select refined grains, can contribute positive nutrition to the American diet. Moreover, added sugars, sodium, and solid fats are not limited to refined grains. Secondary analyses of NHANES 2005–2010 identified several grain food patterns of consumption in US adults and reported an association between grain food consumption and nutrient intakes (3), such that several grain food patterns were linked with greater nutrient intakes, including higher intake of shortfall nutrients and nutrients of public health concern as identified by the 2015–2020 DGA (1). Similarly, certain grain food patterns of consumption in children and adolescents, including both whole and refined grains, were associated with greater intakes of shortfall nutrients and/or nutrients of concern, including iron, magnesium, vitamin D, dietary fiber, and folate, compared with those of children and adolescents consuming nongrain dietary patterns (4). Although previous NHANES analyses did not differentiate between whole grain and refined grain consumption, and focused on dietary patterns as consumed at the time of data collection, it can be assumed that the majority of grain intake was attributable to refined grain intake because <5% of Americans consume the minimum recommendation for whole grain consumption, with the average American consuming <1 oz eq of whole grains per day (2, 5). In addition, recent NHANES analyses in both children and adults suggest that certain grain foods within the refined grain food category contribute meaningful amounts of nutrients to the American diet, whereas others do not. Refined grain foods, including breads, rolls, tortillas, and RTECs, are meaningful contributors (i.e., ≥10% in the diet) of dietary fiber, thiamin, folate, iron, zinc, and niacin to the total American diet. Similarly, when assessing refined grain foods in children and adolescents, breads, rolls, tortillas, and RTECs were major contributors of dietary fiber, thiamin, folate, iron, zinc, and niacin to the American diet of children and adolescents. Likewise, breads, rolls, tortillas, and RTECs also provided meaningful amounts of thiamin, niacin, dietary fiber, iron, and folate to older American adults (6–10). Thus, previous evidence may indicate that classifying all grains that are not whole grains into 1 category of refined grains may not be a fair representation of the nutrient contribution provided by many nutrient-dense enriched grain foods, including breads, rolls, cooked cereals, and RTECs.
Emerging observational research suggests that certain grain foods, as part of a healthy dietary pattern that include a selection of enriched and fortified grains, may improve overall nutrient intakes and minimize gaps in shortfall nutrient intakes. Thus, the goal of the current state-of-the-art review was to conduct an evidence-based session to gauge an expert panel's scientific input on defined areas involving grains, nutrition, and health. The scientific expert panel reached agreement on grain areas of research to discuss prior to an in-person meeting based on scientific and policy messaging from the 2010 and the 2015–2020 DGA (1, 2). The in-person meeting was convened on October 18, 2018, in Washington, DC, and the defined areas reviewed were meant to determine whether scientific consensus could be achieved with regard to the following questions involving grains:
Can fortified and enriched refined grain foods, as part of a dietary pattern, add nutritional value to the American diet?
Do refined grains provide meaningful contributions to nutrient adequacy in the American dietary pattern?
Is refined grain food consumption a contributing factor in overweight and obesity?
Are there gaps in the current scientific literature pertaining to grain foods and health?
Part 1 Expert Panel Discussion: Can Fortified and Enriched Refined Grain Foods, as Part of a Dietary Patten, Add Nutritional Value to the American Diet?
Role of grain foods in helping deliver shortfall nutrients
Irrespective of the substantial contributions made by fortified and enriched refined grains (3–10) to North American diets, such grains are not recommended as foods to increase, with previous and current dietary guidance recommending reduced refined grain consumption in all age groups (1). An analysis in 7250 participants aged 2–18 y from NHANES 2003–2006 found that without enrichment and fortification practices currently in place in the United States, a substantial percentage of all children and adolescents would have inadequate intakes of numerous micronutrients, with the most concerning nutrient inadequacies affecting older adolescent females (11). When evaluating both genders of all ages and considering only intrinsic nutrient intake from foods, results showed that 25–100% had inadequate intakes of dietary folate, calcium, and vitamins A, D, and E. For adolescent females, the researchers reported that 23–92% had inadequate intakes of thiamin, riboflavin, niacin, phosphorus, magnesium, iron, zinc, and vitamins B-6 and C. Further analyses showed that when nutrient intakes contributed from fortification were considered, nutrient intake inadequacies were meaningfully reduced for vitamins A, D, B-6, C, zinc, thiamin, riboflavin, niacin, and folic acid. The researchers concluded that enrichment and fortification added meaningful intake levels to numerous shortfall nutrients, without leading to overconsumption for most vitamins and minerals. Furthermore, the researchers argued that without added nutrients in foods, thiamin, riboflavin, niacin, vitamin B-6, and zinc would also be considered shortfall nutrients, with particular emphasis on older adolescent females (11).
DGA spanning nearly 2 decades have continuously reported on several shortfall nutrients for individuals aged ≥2 y (1, 2, 12, 13). Indeed, the most recent DGA have highlighted both shortfall nutrients and nutrients of public health concern. Specifically, the 2015–2020 DGA policy report (1) stated,
Several nutrients are under-consumed relative to requirement levels set by the Institute of Medicine and the Committee characterized these as shortfall nutrients: vitamin A, vitamin D, vitamin E, vitamin C, folate, calcium, magnesium, fiber, and potassium. For adolescent and premenopausal females, iron also is a shortfall nutrient. Of the shortfall nutrients, calcium, vitamin D, fiber, and potassium also are classified as nutrients of public health concern because their under-consumption has been linked in the scientific literature to adverse health outcomes.
The 2015–2020 DGA policy report further highlights that a healthy dietary pattern incorporates increased consumption of fruits, vegetables, whole grains, low- and nonfat dairy, seafood, legumes, and nuts; moderate intake of alcohol for adults; and reduced consumption of red and processed meat, sugar-sweetened foods and beverages, and refined grains (1). Although dietary guidance routinely recommends restricting intake of refined grains, a large selection of refined grain foods, particularly RTECs and breads, are sources for several shortfall nutrients identified by the 2015–2020 DGA, including folate, iron, magnesium, and dietary fiber. In addition, with the 1998 mandatory folic acid fortification initiative launched by the FDA (14), numerous refined grains have been recognized as leading contributors for dietary folate. In fact, breads, rolls, and crackers are the greatest contributor of total folate to the US diet, providing ∼16% of total intake, which exceeds the contribution of folate from vegetables (15). Similarly, analyses from NHANES 2003–2006 have documented that fortification practices significantly contribute nutrient adequacy in American children and adolescents, devoid of excessive intakes for most vitamins and minerals (11). Whereas 4 of the top 10 ranking foods for energy (i.e., calorie) contribution to the total diet were grain foods in adults, the top 10 ranking food sources of dietary fiber included 5 grain-based foods. For example, yeast breads and rolls ranked as the top source of dietary fiber to the diet of US adults, contributing 10.9% of total dietary fiber (16). Similarly, researchers have demonstrated that 5 of the top 10 greatest contributors of energy intake also contribute ≥10% of the total dietary fiber and micronutrients to the US diet. Indeed, whereas 3 of the top 10 sources of energy provided no nutritional value, the remaining sources of energy, including milk, beef, poultry, cheese, and grain-based baked goods, were significant contributors of nutrients of concern and other essential nutrients; thus, eliminating these foods from food patterns may potentially have inadvertent effects on diet quality in the US population (17).
Grain patterns of consumption and associations with nutrient intakes and diet quality
Limited data are available to assess grain patterns of consumption and associations to nutrient intakes and diet quality in the American population. For adults, a recent analysis using data from What We Eat in America (WWEIA), 2005–2010, the dietary component of NHANES, identified commonly consumed grain food patterns in US adults and compared nutrient intakes, diet quality, and health parameters of those consuming various grain food patterns to those not consuming main grain foods. Although the analysis did not differentiate between whole and refined grain consumption, it has been established that very few adults meet whole grain consumption recommendations. Specifically, it has been previously reported that <8% of US adults consume at least the recommended 3 whole grain oz eq per day, whereas ∼50% of adults consume >0 and <3 whole grain oz eq per day, and nearly 42% reported not consuming any whole grains (18). Likewise, data stemming from WWEIA 2007–2010 showed that the estimated percentage of the US population consuming below established whole grain recommendations is >95% in all children and adults (19). As a result, it is reasonable to assume that a major portion of grain consumption in the US diet is composed of refined grain foods. Using data from WWEIA 2005–2010 for all adults aged ≥19 y, cluster analysis identified 8 unique grain food patterns that focused on breads/rolls, quick breads, cereals, pasta/rice, crackers/salty snacks, cakes/cookies/pies, mixed grains (i.e., defined as 50% of grains coming from yeast bread/rolls), and no grain foods. When examining 2015–2020 DGA's 4 nutrients of concern—dietary fiber, calcium, potassium, and vitamin D—calcium intake was greater in adults consuming cereals compared with those not consuming grain foods (3). Dietary fiber was also higher in adults consuming cereals, pasta, cooked cereals and rice, and quick breads, ranging from 3.1 to 4.5 g/d of increased fiber consumption compared with those in the no grains group. Vitamin D was greater in those consuming cereals, pasta, cooked cereals and rice, and mixed grains, whereas potassium was lower in adults consuming crackers and salty snacks and cakes, cookies, and pies compared with adults not consuming grain food products. The analysis also examined nutrients added to grain foods, via either enrichment or fortification practices, and found beneficial outcomes related to grain consumption. Iron intake was higher in adults in all grain food patterns examined except for those consuming indulgent grain foods (i.e., grains foods with higher added sugars and/or saturated fat and/or sodium, including cakes, cookies, and pies), whereas adults consuming yeast breads and rolls, cereals, pasta, cooked cereals and rice, and mixed grains had significantly greater intake of thiamin and riboflavin compared with adults avoiding grain foods. Likewise, dietary folate was higher in those in all grain food clusters, except crackers and salty snacks and cakes, cookies, and pies, whereas zinc intake was higher only in adults consuming cereals compared with adults in the no grains cluster. Magnesium intakes were significantly greater in adults consuming cereals and pasta, cooked cereals, and rice patterns relative to the no grains group. Diet quality, as measured by the USDA's Healthy Eating Index–2010, showed that .adults in several grain-based dietary clusters (whole and refined grains) had significantly higher scores (i.e., better diet quality) relative to the no grains food pattern (3).
A similar analysis using NHANES 2005–2010 was completed in children to identify the most commonly consumed grain food patterns and compare nutrient intakes and diet quality in comparison to those children engaging in grain avoidance (4). Dietary fiber intake was significantly greater in 5 of the 8 patterns, ranging from 1.8 to 2.8 g more per day, compared with those consuming no grain foods. Iron intake was greater across all 7 grain clusters examined, showing the contribution of enriched grain foods to the diet. Vitamin D was significantly greater in those consuming cereals, and potassium was higher in children consuming pasta, cooked cereals, and rice compared with those not consuming grain food products. Intakes of thiamin and riboflavin were significantly higher for children and adolescents consuming all grain clusters, except for cakes, cookies, and pies, compared with those not consuming grain foods. Similarly, folate was significantly higher in those in all grain food clusters, except cakes, cookies, and pies, compared with the no grains cluster. Zinc intake was higher only in children and adolescents consuming yeast breads and rolls, cereals, and quick breads and lower in those consuming cakes, cookies, and pies compared with those in the no grains cluster. Magnesium intakes were significantly greater in those consuming all clusters except those in the cakes, cookies, and pies and the pancakes, waffles, French toast, and other grains clusters compared with the no grains group. Saturated fat intake was lower in all grain patterns examined compared with those not consuming grain foods, with the difference in saturated fat ranging from 1.5 to 4.8 g less per day. Sodium intake was lower (−350 mg/d) in children and adolescents consuming cakes, cookies, and pies and greater in children and adolescents consuming pasta, cooked cereals, and rice compared with the no grains cluster pattern. There were no significant differences in total and added sugar intake across all grain clusters compared with the no grain cluster. Relative to children in the no grain dietary pattern, those in several grain food patterns of consumption, including bread/rolls, pasta/cereals/rice, and crackers/salty snacks, had a significantly higher diet quality (4).
Thus, based on the 2 available observational studies (3, 4) examining grain patterns of consumption, evidence in children and adults supports that a variety of grain food patterns, including those recommended by dietary guidance and those that focus on enriched and fortified grain staples, are associated with greater nutrient intakes, including higher consumption of shortfall nutrients and nutrients of public health concern as identified by the 2015–2020 DGA (1), compared with patterns that use no grain foods.
Grain foods as sources of energy and nutrients
US dietary guidance has consistently encouraged placing limits on added sugar, saturated fat, and sodium, and in many instances there have been recommendations to monitor total sugar and fat intake (1, 2, 12, 13, 19, 20). Although both whole and refined grain food products can contribute meaningful amounts of these nutrients, many whole and refined grain foods can provide meaningful nutrient contributions to the diet, including dietary fiber, iron, magnesium, and B vitamins. Recently, 3 analyses (6–8) have been completed that demonstrate meaningful nutrient density contribution levels of grain foods and subcategories of grain foods in the American diet.
Grain food sources of energy and nutrients in US children and adolescents
Observational data from NHANES 2009–2012 found that all grain foods (i.e., whole and refined grain foods combined) provided approximately 14% of total daily calories, 8% of total fat, 5% of saturated fat, 8% of total sugar, and 16% of sodium in the American diet of children and adolescents. In addition, all grain foods contributed approximately 25% of daily fiber, 35% of iron, 14% of magnesium, 39% of folate, and 16% of vitamin A in the total diet (6). When examining subgroups of the grain food category, breads, rolls, and tortillas and RTECs were meaningful contributors of several nutrients to encourage. Specifically, breads, rolls, and tortillas contributed 7% of total daily calories, 8% of sodium, 2% of total sugar, 3% of total fat, and 2% of saturated fat in exchange for 14% of total folate, 12% of fiber, 12% of iron, and of 7% magnesium and calcium in the total diet. All whole and refined grain RTECs provided 18% of folate, 17% of iron, 13% of vitamin B-12 and niacin, 12% of vitamin A, 10% of zinc, and 7% of fiber and vitamin D in the total diet, in addition to contributing <5% of total daily calories, total sugar, sodium, and total and saturated fat in the diet of US children and adolescents (6).
Grain food sources of energy and nutrients in US adults
Comparable to data published in children and adolescents, a recent NHANES analysis evaluated sources of energy and nutrients derived from the grain food category in adults (7). For 14% of all calories in the diet, whole and refined grain foods combined contributed 15% of sodium, 8% of total sugar, 7% of total fat, and 5% of saturated fat. In addition, grain foods provided 25% of all total dietary fiber and substantial amounts of vitamins (34% of folate, 30% of thiamin, 21% of niacin, 16% of riboflavin, 16% of vitamin B-6, 11% of vitamin A, and 11% of vitamin B-12) and minerals (30% of iron, 15% of zinc, 14% of magnesium, 13% of phosphorus, and 13% of calcium) per day; dietary fiber, folate, vitamin A, iron, magnesium, and calcium are all 2015–2020 DGA designated shortfall nutrients. Therefore, grain foods in the American diet deliver nutrient density while simultaneously providing meaningful amounts of several 2015–2020 DGA shortfall nutrients (7).
Further analyses have examined subcategories of grain foods, with particular focus on refined grain products, as sources of energy and nutrients by gender (7). Using data from NHANES 2009–2012, it has been documented that breads, rolls, and tortillas contribute approximately 8% of sodium, 3% of total sugar, 4% of total fat, and 3% of saturated fat, for ∼8% of total energy in the daily diet of adult women. In addition, when considering 2015–2020 DGA shortfall nutrients, breads, rolls, and tortillas contribute approximately 12% of total dietary fiber, 15% of folate, 13% of iron, 8% of calcium, and 7% of magnesium on a daily basis, Breads, rolls, and tortillas also contribute approximately 16% of thiamin, 11% of niacin, 7% of riboflavin, and 6% of zinc daily. Similar findings were seen in adult men: 8% of sodium, 4% of total sugar, 3% of total fat, 3% of saturated fat, and 8% of total energy in the daily diet were provided by breads, rolls, and tortillas. For shortfall nutrients identified by the 2015–2020 DGA, breads, rolls, and tortillas contributed approximately 14% of total dietary fiber, 16% of folate, 13% of iron, 9% of calcium, and 8% of magnesium. Breads, rolls, and tortillas further contributed approximately 17% of thiamin, 10% of niacin, 7% of riboflavin, and 6% of zinc per day (7).
Results further showed that as a grain category, RTECs provide approximately 2% of total calories, 2% of sodium, 3% of total sugar, 1% of total fat, and 1% of saturated fat in the American adult woman's diet. RTECs were also an important source for shortfall nutrients in the American diet, with approximately 5% of total dietary fiber, 11% of folate, 11% of iron, and 5% of vitamin D contributed daily. In addition, RTECs contributed 9% of vitamin B-12, 9% of vitamin B-6, 8% of thiamin, 7% of niacin, 7% of vitamin A, 6% of riboflavin, and 6% of zinc per day. Similar findings were reported in US adult men, such that all RTECs provided approximately 2% of sodium, 3% of total sugar, and 1% of total fat and saturated fat in the daily diet, in exchange for 2% of total calories. When considering shortfall nutrients, RTECs contributed approximately 14% of total dietary fiber, 16% of folate, 13% of iron, 9% of calcium, 8% of magnesium, 17% of thiamin, 10% of niacin, 7% of riboflavin, and 6% of zinc per day (7).
Expert Panel Consensus
Grain foods make meaningful nutrient contributions to US dietary patterns. In particular, both whole and refined grain foods can play a role in helping deliver shortfall nutrients to the American population.
Grain foods are meaningful contributors of nutrient density in the American diet in both children and adults, with particular emphasis on RTECs, breads, rolls, and tortillas.
Part 2 Expert Panel Discussion: Do Refined Grains Provide Meaningful Contributions to Nutrient Adequacy in the American Dietary Pattern?
Current nutrition trends have questioned and at times negatively portrayed the roles of grains and carbohydrates in the diet and the contribution to overall health (20–22). In fact, in the current nutrition environment, the perception of breads and other grain products is that most, if not all, grain foods have little or no nutrient and/or nutrition contribution to the overall diet and thus no influence with regard to overall public health. Moreover, consumers and health care professional alike may not understand and/or appreciate the rationale as to how fortification and enrichment factor into the American diet and public health. Although in 2011 the CDC highlighted folate fortification as 1 of the top 10 public health achievements of the century (23), there was little fanfare and/or promotion of the scientific accomplishment. As such, a key discussion point within the expert panel was the current gap in the published scientific literature on the role of grains and nutrient adequacy in the American diet. Therefore, the expert panel agreed that a necessary next step was to conduct a modeling analysis using data from NHANES 2009–2016 in children/adolescents and adults to determine the role of grains, breads, and RTECs and nutrient adequacy in the diet. The study objectives included the following:
Determining nutrient adequacy outcomes when removing 25%, 50%, and 100% of all breads consumed in the American diet
Determining nutrient adequacy outcomes when removing 25%, 50%, and 100% of all breads and RTECs in the American diet
Determining nutrient adequacy outcomes when removing 25%, 50%, and 100% of all grains (i.e., that are either enriched or fortified) in the American diet
Methods
NHANES is a nationally representative, cross-sectional survey of US noninstitutionalized, civilian residents. Data are collected by the National Center for Health Statistics of the CDC. Written informed consent has been previously obtained for all participants or proxies, and the survey protocol has been approved by the Research Ethics Review Board at the National Center for Health Statistics. Data from the NHANES 2009–2016 data set were used to complete the analyses in children and adults aged ≥19 y. Nutrient intake data for NHANES 2009–2016 are from the USDA Food and Nutrient Database for Dietary Studies 2013–2014 (FNDDS) (24). FNDDS provides the nutrient values for foods and beverages reported in WWEIA, the dietary intake component of NHANES for each data release. The WWEIA Food Categories provide an application to analyze food and beverages as consumed in the American diet. The classification scheme includes 150 unique categories, and there are 15 main food groups and 46 subcategories of foods. WWEIA food categories have been previously published by the USDA (25).
In the current nutrient adequacy analyses, the modeling represented theoretical removal of select grain foods (i.e., breads and RTECs) and all grain foods from dietary patterns. The modeling exercise was meant to amplify how removal of enriched and/or fortified foods such as grains can impact nutrient adequacy in Americans.
The NHANES data set sample included 13,799 men and women participants aged ≥19 y for whom there were reliable and complete 24-h dietary intake data from WWEIA. Trained individuals complete the 24-h dietary recalls using USDA's dietary data collection instrument, the Automated Multiple-Pass Method, which includes detailed descriptions of all food and amounts consumed by subjects (26).
Two days of 24-h dietary recalls were used to determine usual intakes with the National Cancer Institute method (27, 28). Usual intake means, percentiles, and percentages meeting National Academy of Medicine DRI cutoffs [i.e., estimated average requirement (EAR) and Adequate Intake (AI)] were estimated using version 2.1 of the National Cancer Institute method and were used to evaluate the impact of grain removal. The percentage of the population below the EAR or above the AI were assessed using the cut-point method, except for iron, which was assessed using the probability method (29). Covariates used in the analysis were day sequence, weekend, DRI age groups, and gender. The removal modeling scenarios were as follows: 1) “as is” dietary intake to represent the current nutrient intake; 2) 25%, 50%, and 100% removal of breads [WWEIA category 4202 (yeast breads)]; 3) 25%, 50%, and 100% removal of yeast breads and RTECs (WWEIA category 4202 or subgroup 46); and 4) 25%, 50%, and 100% removal of all grain foods (WWEIA main group 4; fortified and/or enriched grains).
All statistical analyses were performed using SAS software version 9.2 (SAS Institute). While NHANES makes available nutrients from dietary supplements, the present analysis did not include dietary supplements in the analysis to focus on nutrients solely from food and beverages.
Results
Nutrient adequacy results in children and adults following the removal of breads, bread and RTECs, and all grains are shown in Figures 1–13 (note: data for dietary fiber intake in children are not shown as current dietary patterns show that <1% of children are above the AI for fiber intake). NHANES 2009–2016 data show that large percentages of the American population are not meeting recommendations set forth by authoritative guidelines. In addition, the current analysis demonstrates that the grain food category is an integral component of nutrient adequacy in both children and adults. Indeed, reducing the percentage of breads and RTECs consumed in the diet resulted in more children and adults not meeting recommendations for several nutrients, thus increasing nutrient inadequacy in the American population. Similarly, removing all grain foods from the diet resulted in more children and adults falling below recommendations for several nutrients, including shortfall nutrients as identified by 2015–2020 DGA.
FIGURE 1.
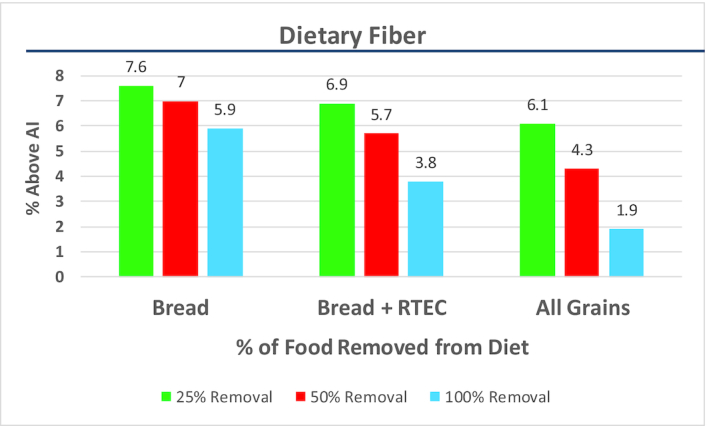
Percentage of adults above the AI for dietary fiber when select grain foods are removed from the current diet. Data are for adults aged ≥19 y; NHANES: 2009–2016. The black line represents the percentage of adults above the AI for dietary fiber (8.9%). AI, Adequate Intake; RTEC, ready-to-eat cereals.
FIGURE 2.
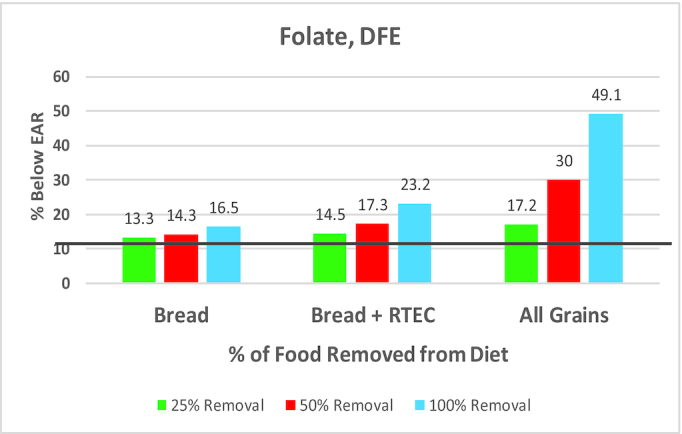
Percentage of adults below the EAR for dietary folate when select grain foods are removed from the current diet. Data are for adults aged ≥19 y; NHANES: 2009–2016. The black line represents the percentage of adults below the EAR for dietary folate (12.2%). DFE, dietary folate equivalents; EAR, estimated average requirement; RTEC, ready-to-eat cereals.
FIGURE 3.
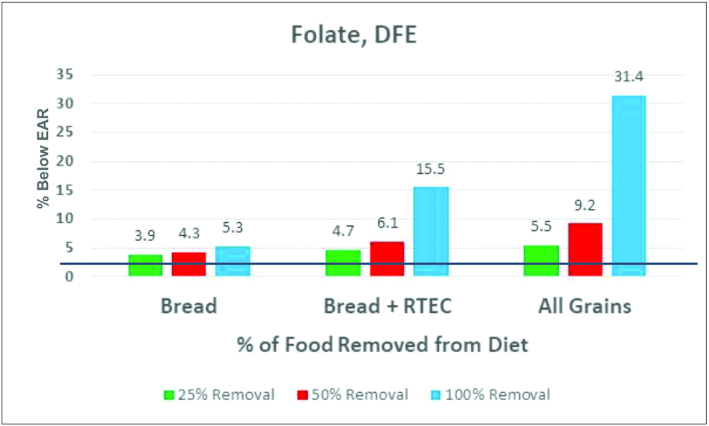
Percentage of children/adolescents below the EAR for dietary folate when select grain foods are removed from the current diet. Data are for children/adolescents aged 2–18 y; NHANES: 2009–2016. The black line represents the percentage of adults below the EAR for dietary folate (3.6%). DFE, dietary folate equivalents; EAR, estimated average requirement; RTEC, ready-to-eat cereals.
FIGURE 4.
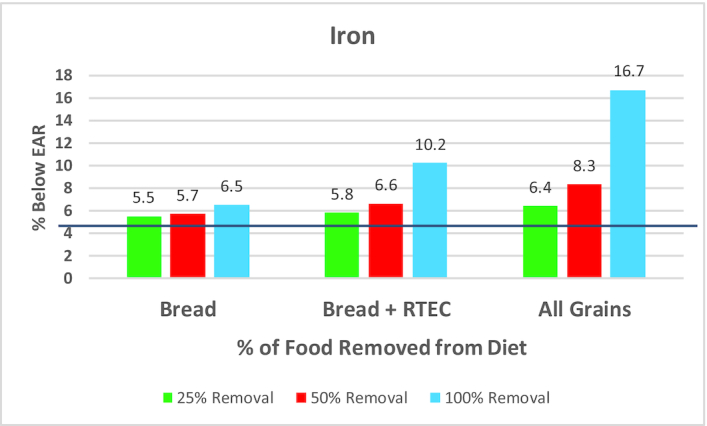
Percentage of adults below the EAR for iron when select grain foods are removed from the current diet. Data are for adults aged ≥19 y; NHANES: 2009–2016. The black line represents the percentage of adults below the EAR for iron (5.1%). EAR, estimated average requirement; RTEC, ready-to-eat cereals.
FIGURE 5.
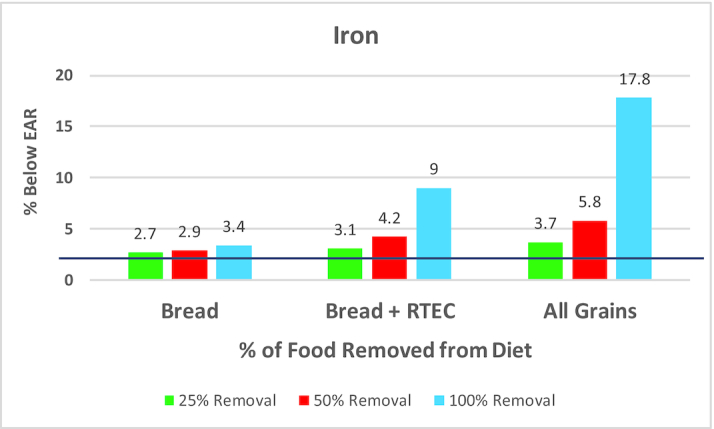
Percentage of children/adolescents below the EAR for iron when select grain foods are removed from the current diet. Data are for children/adolescents aged 2–18 y; NHANES: 2009–2016. The black line represents the percentage of adults below the EAR for iron (2.5%). EAR, estimated average requirement; RTEC, ready-to-eat cereals.
FIGURE 6.
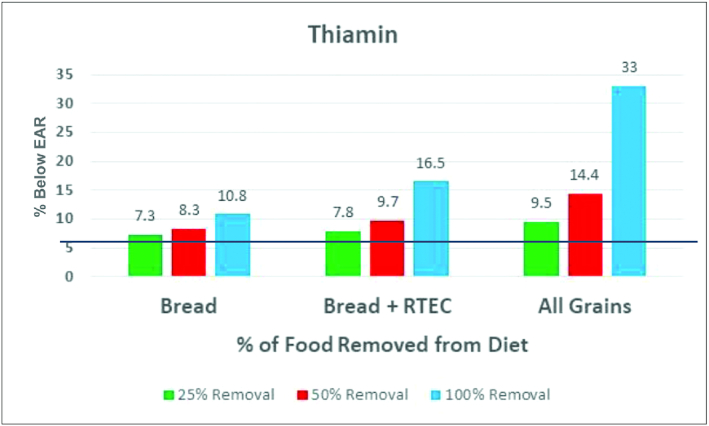
Percentage of adults below the EAR for thiamin when select grain foods are removed from the current diet. Data are for adults aged ≥19 y; NHANES: 2009–2016. The black line represents the percentage of adults below the EAR for thiamin (6.5%). EAR, estimated average requirement; RTEC, ready-to-eat cereals.
FIGURE 7.
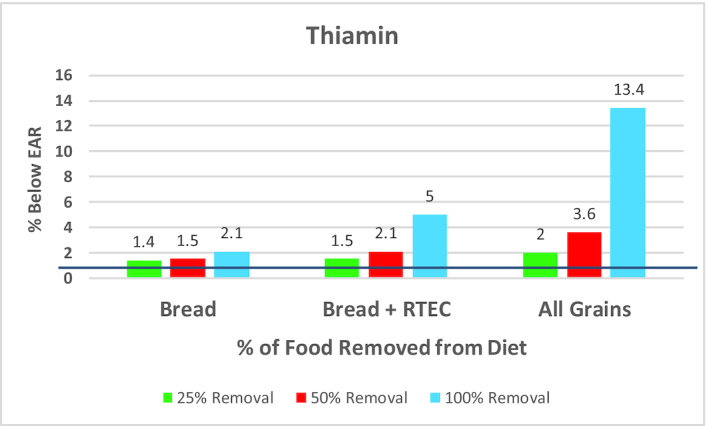
Percentage of children/adolescents below the EAR for thiamin when select grain foods are removed from the current diet. Data are for children/adolescents aged 2–18 y; NHANES: 2009–2016. The black line represents the percentage of adults below the EAR for thiamin (1.2%). EAR, estimated average requirement; RTEC, ready-to-eat cereals.
FIGURE 8.
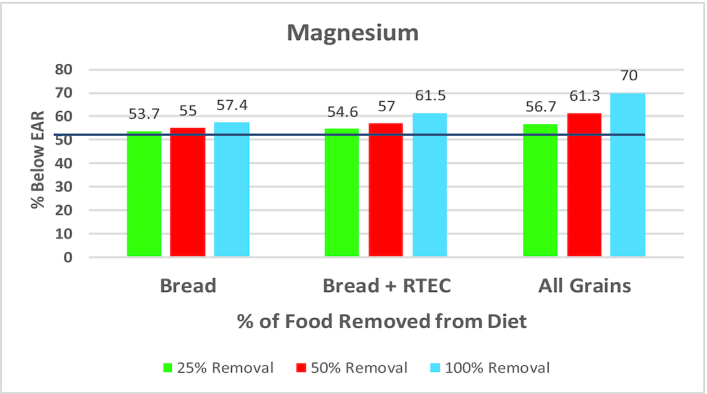
Percentage of adults below the EAR for magnesium when select grain foods are removed from the current diet. Data are for adults aged ≥19 y; NHANES: 2009–2016. The black line represents the percentage of adults below the EAR for magnesium (52.4%). EAR, estimated average requirement; RTEC, ready-to-eat cereals.
FIGURE 9.
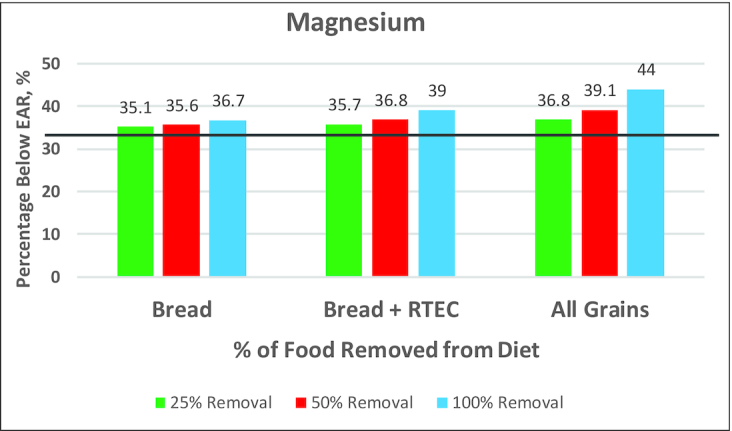
Percentage of children/adolescents below the EAR for magnesium when select grain foods are removed from the current diet. Data are for children/adolescents aged 2–18 y; NHANES: 2009–2016. The black line represents the percentage of adults below the EAR for magnesium (34.5%). EAR, estimated average requirement; RTEC, ready-to-eat cereals.
FIGURE 10.
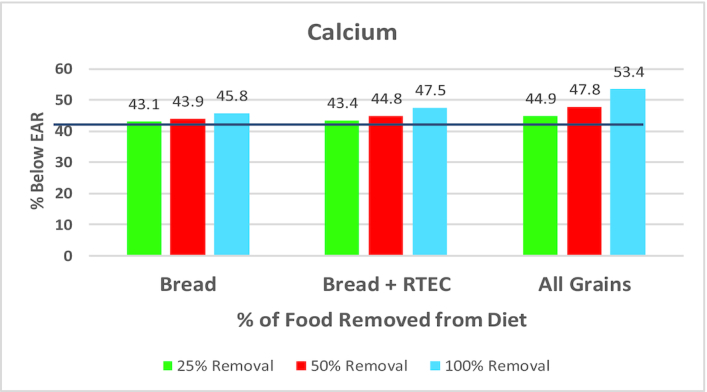
Percentage of adults below the EAR for calcium when select grain foods are removed from the current diet. Data are for adults aged ≥19 y; NHANES: 2009–2016. The black line represents the percentage of adults below the EAR for calcium (42.1%). EAR, estimated average requirement; RTEC, ready-to-eat cereals.
FIGURE 11.
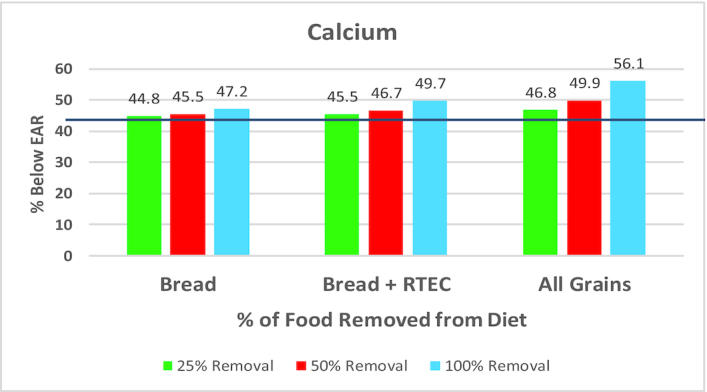
Percentage of children/adolescents below the EAR for calcium when select grain foods are removed from the current diet. Data are for children/adolescents aged 2–18 y; NHANES: 2009–2016. The black line represents the percentage of adults below the EAR for calcium (43.8%). EAR, estimated average requirement; RTEC, ready-to-eat cereals.
FIGURE 12.
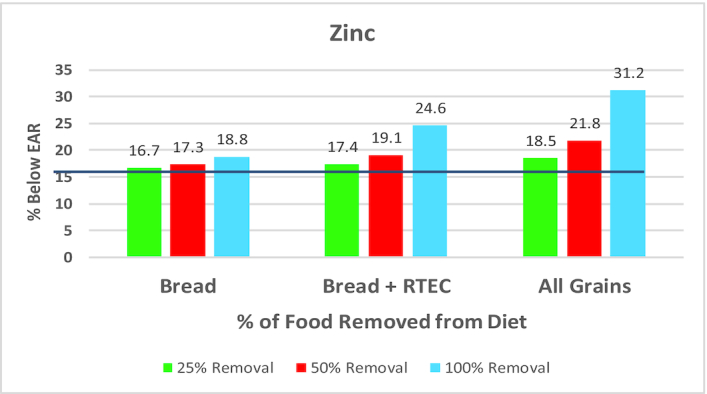
Percentage of adults below the EAR for zinc when select grain foods are removed from the current diet. Data are for adults aged ≥19 y; NHANES: 2009–2016. The black line represents the percentage of adults below the EAR for zinc (16.0%). EAR, estimated average requirement; RTEC, ready-to-eat cereals.
FIGURE 13.
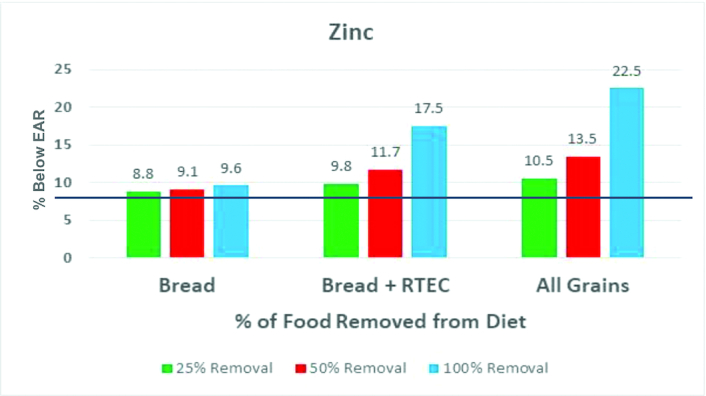
Percentage of children/adolescents below the EAR for zinc when select grain foods are removed from the current diet. Data are for children/adolescents aged 2–18 y; NHANES: 2009–2016. The black line represents the percentage of adults below the EAR for zinc (8.6%). EAR, estimated average requirement; RTEC, ready-to-eat cereals.
The current modeling analysis to remove grain foods from the American diet aligns with findings in several published studies considering enriched grain foods. Previous data outline the critical nutritional component of the inclusion of enrichment and fortification practices in dietary patterns. Specifically, previous modeling shows that for dietary patterns that do not include enrichment and fortification of foods, the percentage of American children and adults not meeting recommendations for calcium, iron, folate, vitamin A, vitamin C, vitamin E, vitamin D, and thiamin substantially increases. Modeling evidence also supports decreases in inadequate intakes of iron, folate, and vitamins A and D when nutrients are added via enrichment and fortification methods (30). Grain food studies, using data from NHANES, further support the functional benefits of enrichment and fortification practices. Fortified RTEC has been shown to be a key facilitator in helping Americans meet recommended nutrient intakes. Indeed, RTEC consumption in children resulted in significant increases in iron, zinc, vitamin A, vitamin B-6, vitamin E, vitamin D, thiamin, niacin, and folate intake. Likewise, consumption of RTECs resulted in significant increases in iron, zinc, niacin, riboflavin, thiamin, and vitamins A, B-6, B-12, and E (31). When considering all Americans (i.e., aged ≥2 y), recent data from NHANES also show that enriched and fortified grain foods are a major source of numerous vitamins and minerals in the overall diet, thus lending additional evidence to support the notion that enrichment and fortification help reduce nutrient intake shortfalls in the US diet (11). Earlier NHANES data (2003–2006) demonstrated that fortified grain products contribute meaningful nutrient adequacy for vitamins and minerals in American children, without attaining excessive intakes (32). Others have suggested that approximately half of the American population would present inadequate intakes for thiamin without current enrichment and fortification policies compared with current policies that demonstrate only 5% of the population exhibit inadequate intakes. Likewise, without mandated fortification of folic acid in grain foods, ∼9 out of 10 Americans would exhibit inadequate intake compared with 10% with consumption of fortified grain foods (33).
Although the current analysis demonstrates the important contributions that enriched and fortified grain foods provide to dietary patterns, there are limitations that can be further explored in future studies. For example, the current analysis did not investigate the removal of indulgent grain foods (i.e., cakes, cookies, pies, etc.) from the American diet. In addition, the it did not consider modeling outcomes for added sugar, sodium, and saturated fat when specific grain foods are removed from the diet. Because the 2015–2020 DGA has reported that grain foods can be a substantial source for added sugar, sodium, and saturated fat (1), the assumption is that removal of breads and cereals in the diet will coincide with reductions in these nutrients. Nonetheless, reductions in added sugar, sodium, and saturated fat by grain food manufacturers will likely have an impact on intakes and should be monitored in future research.
Expert Panel Consensus
Grain foods make meaningful contributions to nutrient adequacy in the diet of US children and adults.
Currently with US typical dietary patterns, a large percentage of children and adults are not meeting recommendations set forth by authoritative dietary guidance. Removing portions or all of certain whole and refined grain foods from the diet can further exacerbate nutrient inadequacies in US children and adults.
Similarly, removing refined grains from the diet results in more children and adults falling below recommendations for shortfall nutrients as identified by 2015–2020 DGA.
Part 3 Expert Panel Discussion: Is Refined Grain Food Consumption a Contributing Factor in Overweight and Obesity?
Numerous prospective cohort studies have documented the health benefits linked to whole grain consumption (34–44), with limited data available to ascertain the health implications of refined grain consumption. A recent review by Gaesser (45) summarized evidence linking increased whole grain consumption with reduced risk for several disease outcomes, including type 2 diabetes, cardiovascular disease, and all-cause mortality. The review further acknowledges that in order to “achieve the recommended balance of whole and refined grain intake, it would require increasing whole grain intake while simultaneously decreasing intake of refined grains” (45). The 2015 Dietary Guidelines Advisory Committee (DGAC) scientific report encouraged reduction of refined grain consumption based on evidence that a dietary pattern with lower refined grain foods is linked with reduced risk for cardiovascular disease, type 2 diabetes, and obesity (19). The expert panel discussion remained focused on the latter and asked the following question: Is there evidence to support that refined grain consumption negatively contributes to weight-related outcomes? Gaesser (45) reviewed the literature focusing on refined grain consumption and weight-related outcomes and reported the following:
No meta-analyses on the association between refined grain intake and measures of body weight or body fat have been conducted.
Three systematic reviews reported no consistent relation between refined grain intake and BMI or measures of adiposity (46–48).
Several cohort studies show no association between refined grain consumption and BMI (35, 39, 40, 43, 49–53).
Although several studies have demonstrated a positive association between refined grain intake and BMI (50, 54–59) or body fat (60), the magnitude of the difference between extremes of refined grain intake is typically very small and, thus, clinical relevance of the findings remains to be determined.
As a result of these data being presented to the expert panel and, concurrently, recognizing that limited data are available that consider whole grain, refined grain, and bread intakes in relation to weight parameters, the expert panel focused discussion around conducting trend analyses to address this gap in the literature. Thus, several trend analyses were conducted using data from NHANES III (1988–1994) and NHANES 1999–2016. Adults (aged ≥18 y, n = 43,268) were included in the analyses following exclusions for unreliable data and pregnant or lactating women.
Results support significant elevations in BMI and waist circumference in all American adults from 1988 through 2016 (Figures 14 and 15). However, although whole grain intake (Figure 16) has only modestly increased in women, and not men, refined grain consumption (Figure 17) has not significantly increased. Coinciding with these results, bread intake has significantly decreased in American adults during the same time period (Figure 18). The temporal dissociation between increases in BMI and waist circumference and no change in refined grain intake and decreases in bread consumption are not consistent with the perception that refined grains and bread contributed to increased obesity prevalence between 1988 and 2016. The current NHANES trend analyses further lend support to the discussion and questions raised by Gaesser (45), such that refined grains are 1 food component of the unhealthy Western dietary pattern—an eating pattern associated with increased obesity risk. Consequently, it is justified to ask whether each food group in this dietary pattern independently contributes to increased risk of obesity, as has been described by DGAC (19), or whether it is possible that the higher risk is not due to refined grain intake but instead is a consequence of “guilt by association” with other foods in the dietary pattern.
FIGURE 14.
BMI trends from 1988 to 2016 in US adults. NHANES (1988–2016): N for men = 21,731; N for women = 21,537.
FIGURE 15.
Waist circumference trends from 1988 to 2016 in US adults. NHANES (1988–2016): N for men = 21,731; N for women = 21,537.
FIGURE 16.
Whole grain intake (oz eq) trends from 1988 to 2016 in US adults. NHANES (1988–2016): N for men = 21,731; N for women = 21,537.
FIGURE 17.
Refined grain intake (oz eq) trends from 1988 to 2016 in US adults. NHANES (1988–2016): N for men = 21,731; N for women = 21,537.
FIGURE 18.
Bread intake (g) trends from 1988 to 2016 in US adults. NHANES (1988–2016): N for men = 21,731; N for women = 21,537.
Previous work examining grain food patterns of consumption by US adults reported that although all grain food patterns were associated with higher daily calories, no significant associations were observed with weight-related outcomes, including BMI and waist circumference, compared with adults not consuming grain foods (3). Nonetheless, adults consuming a grain pattern predominantly composed of pasta, cooked cereals, and rice had significantly lower body weights and smaller waist circumferences compared with adults not consuming grain foods. Furthermore, these adults had a 27% reduced risk of being overweight or obese and a 31% reduced risk of having an increased waist size (3). A similar analysis that examined associations between grain patterns of consumption and weight-related parameters in children and adolescents also revealed that energy intake was significantly higher for children in several grain patterns. However, children and adolescents consuming several grain food patterns predominantly composed of refined grains had a significantly lower risk of being overweight or obese compared with those consuming no grain foods. In addition, compared with children and adolescents not consuming grains, those consuming several grain foods had lower BMI z scores (4).
Expert Panel Consensus
Available scientific evidence does not support the notion that refined grain consumption is linked to increased risk of overweight and obesity.
Limiting consumption of indulgent refined grains, due to contributions of calories, added sugar, sodium, and saturated fat, may be necessary within dietary patterns.
Evolving dietary guidance needs to evaluate emerging grain research to address the nutritional relevance of certain refined grain foods within dietary patterns.
Part 4 Expert Panel Discussion: Are There Gaps in the Current Scientific Literature Pertaining to Grain Foods and Health?
As previously discussed, recommendations to increase whole grains are supported by numerous epidemiological studies that have linked greater whole grain intake to several nutrition and health-related benefits. The 2015–2020 DGA (1) has been explicit in guidance to increase consumption of whole grains while concurrently limiting consumption of refined grain foods. However, although 2015–2020 DGA has suggested that at least half of all recommended servings be consumed as whole grains, rationale has also been provided for the inclusion of refined grains within dietary patterns. Specifically, 2015–2020 DGA stated that modeling analyses demonstrate that without the inclusion of refined grain in dietary patterns, many Americans would fall short of recommendations for several nutrients (1). Thus, based on the available evidence, the expert panel was in agreement to continue support of dietary guidance to increase whole grain consumption in the American diet. However, the expert panel further initiated discussions regarding whether current categorization of grain foods should go beyond whole and refined grains. Data published in the past decade have begun to call into question whether all grains not classified as “whole” fall into the “refined grain” categorization. Indeed, classifying all grains that are not “whole grains” into the 1 category of refined grains may not be a justified nor a nutritionally valid representation of the nutrient contribution provided by many nutrient-dense enriched grain foods that are deemed to be refined grains, including breads, rolls, cooked cereals, and RTECs. Previous surveys have reported that only 5% of Americans consume the minimum recommended amount of whole grains, with the average American consuming <1 oz eq of whole grains per day (2, 5). It can be assumed that the predominant type of grains consumed by Americans, based on NHANES data, is refined and/or enriched grains. Recent analyses using NHANES 2009–2012 demonstrated that grain foods are contributors of the 2015–2020 DGA underconsumed nutrients and nutrients of public health concern (6–8), including dietary fiber, folate, magnesium, calcium, and iron. When considering subcategories of grain foods, breads, rolls, tortillas, and RTECs were meaningful contributors (i.e., ≥10% in the diet) of dietary fiber, thiamin, folate, iron, zinc, and niacin to the American diet of children and adolescents.
Expert Panel Consensus
The current categorization of refined grain foods may need further delineation, particularly because current evidence suggests differences in nutrient contribution from breads and cereals compared with indulgent grain foods such as cakes, cookies, and pies.
Future research should consider distinguishing different types of refined grain foods with the goal of potentially creating an additional classification of grains that goes beyond whole and refined. For example, dietary pattern–focused research needs to separate refined grains (i.e., breads and cereals from cakes, cookies, and pies) when assessing nutrient intake, diet quality, and health-related outcomes.
Future research needs to repeat currently available analyses with epidemiological-based databases other than NHANES. For example, the expert panel recommends conducting analyses using large cohorts, including the Nurses’ Health Study and Health Professional Follow-Up Study, in which refined grains are further distinguished (i.e., refined grain categories need to differentiate between breads and cereals and cakes, cookies, and pies, etc.).
ACKNOWLEDGEMENTS
The authors’ responsibilities were as follows—YP, JLS, RC, JTB, DH, GAG, and VLF: collaborated on the intellectual conception, design, and interpretation of the research; YP and VLF: drafted the manuscript; and all authors: read and approved the final manuscript.
Notes
Supported by the Grain Foods Foundation.
Author disclosures: The sponsors (Grain Foods Foundation) had no role in the design of the study or in the collection, analyses, or interpretation of the data. YP, as President of Nutritional Strategies, provides food, nutrition, and regulatory affairs consulting services for food and beverage companies and food-related associations and collaborates with VLF on NHANES analyses. VLF, as Senior Vice President of Nutrition Impact, provides food and nutrition consulting services for food and beverage companies. VLF also conducts analyses of NHANES data for members of the food industry. JLS, RC, JTB, DH, and GAG all received an honorarium and travel expenses in the current scientific collaboration. The questions addressed in the current article are sourced from presentations and discussions around the available published science that happened during the pre-meeting session and the 1-d in-person meeting. The panelists during the discussions were JLS, RC, JTB, DH, and GAG. Moderation of the event was conducted by YP and VLF.
JLS and RC were members of the 2010 Dietary Guidelines Scientific Advisory Committee. JTB was a member of the 2015 Dietary Guidelines Scientific Advisory Committee.
Abbreviations used: AI, Adequate Intake; DGA, Dietary Guidelines for Americans; DGAC, Dietary Guidelines Advisory Committee; EAR, estimated average requirement; FNDDS, Food and Nutrition Database for Dietary Studies; RTEC, ready-to-eat cereal; WWEIA, What We Eat in America.
Contributor Information
Yanni Papanikolaou, Email: papanikolaou.yanni@gmail.com, Nutritional Strategies, Paris, Canada.
Joanne L Slavin, Department of Food Science and Nutrition, University of Minnesota, St. Paul, MN, USA.
Roger Clemens, USC School of Pharmacy, University of Southern California, Los Angeles, CA, USA.
J Thomas Brenna, Department of Pediatrics, Dell Medical School, University of Texas at Austin, Austin, TX, USA.
Dayle Hayes, Nutrition for the Future, Bozeman, MT, USA.
Glenn A Gaesser, College of Health Solutions, Arizona State University, Phoenix, AZ, USA.
Victor L Fulgoni, III, Nutrition Impact, Battle Creek, MI, USA.
References
- 1. US Department of Health and Human Services and USDA 2015–2020 Dietary Guidelines for Americans. [Internet] 8th ed 2015; [cited 2019 Dec 20]. Available from: https://health.gov/dietaryguidelines/2015/resources/2015-2020_Dietary_Guidelines.pdf. [Google Scholar]
- 2. US Department of Health and Human Services and USDA Dietary Guidelines for Americans, 2010. [Internet] 7th ed December2010; [cited 2019 Dec 20]. Available from: https://www.dietaryguidelines.gov/sites/default/files/2019-05/DietaryGuidelines2010.pdf. [Google Scholar]
- 3. Papanikolaou Y, Fulgoni VL. Certain grain food patterns are associated with improved 2015 Dietary Guidelines shortfall nutrient intakes, diet quality, and lower body weight in US adults: results from the National Health and Nutrition Examination Survey, 2005–2010. Food Nutr Sci. 2016;7:772–81. [Google Scholar]
- 4. Papanikolaou Y, Miller-Jones J, Fulgoni VL. Several grain dietary patterns are associated with better diet quality and improved shortfall nutrient intakes in US children and adolescents: a study focusing on the 2015–2020 Dietary Guidelines for Americans. Nutr J. 2017;16:13 doi:10.1186/s12937-017-0230-0. [DOI] [PMC free article] [PubMed] [Google Scholar]
- 5. Reicks M, Jonnalagadda S, Albertson AM, Joshi N. Total dietary fiber intakes in the US population are related to whole grain consumption: results from the National Health and Nutrition Examination Survey 2009–2010. Nutr Res. 2014;34:226–34. [DOI] [PubMed] [Google Scholar]
- 6. Papanikolaou Y, Fulgoni VL. Certain grain foods can be meaningful contributors to nutrient density in the diets of U.S. children and adolescents: data from the National Health and Nutrition Examination Survey, 2009–2012. Nutrients. 2017;9:160 doi:10.3390/nu9020160. [DOI] [PMC free article] [PubMed] [Google Scholar]
- 7. Papanikolaou Y, Fulgoni VL. Grain foods are contributors of nutrient density for American adults and help close nutrient recommendation gaps: data from the National Health and Nutrition Examination Survey, 2009–2012. Nutrients. 2017;9:873 doi:10.3390/nu9080873. [DOI] [PMC free article] [PubMed] [Google Scholar]
- 8. Papanikolaou Y, Fulgoni VL. Grains contribute shortfall nutrients and nutrient density to older US adults: data from the National Health and Nutrition Examination Survey, 2011–2014. Nutrients. 2018;10:E534 doi:10.3390/nu10050534. [DOI] [PMC free article] [PubMed] [Google Scholar]
- 9. Hosseini SH, Papanikolaou Y, Isalm N, Rashmi P, Shamloo A, Vatanparast H. Consumption patterns of grain-based foods among children and adolescents in Canada: evidence from Canadian Community Health Survey–Nutrition 2015. Nutrients. 2019;11:623 doi:10.3390/nu11030623. [DOI] [PMC free article] [PubMed] [Google Scholar]
- 10. Hosseini SH, Jones JM, Vatanparast H. Association between grain intake, nutrient intake, and diet quality of Canadians: evidence from the Canadian Community Health Survey–Nutrition 2015. Nutrients. 2019;11:1937 doi:10.3390/nu11081937. [DOI] [PMC free article] [PubMed] [Google Scholar]
- 11. Fulgoni VL, Keast DR, Bailey RL, Dwyer J. Foods, fortificants, and supplements: where do Americans get their nutrients?. J Nutr. 2011;141:1847–54. [DOI] [PMC free article] [PubMed] [Google Scholar]
- 12. US Department of Health and Human Services/USDA Dietary Guidelines for Americans, 2005. [Internet] 6th ed 2005; [cited 2019 Dec 20]. Available from: https://health.gov/sites/default/files/2020-01/DGA2005.pdf. [Google Scholar]
- 13. US Department of Health and Human Services/USDA Nutrition and your health: Dietary Guidelines for Americans, 2000. [Internet] 5th ed 2005; [cited 2019 Dec 20]. Available from: https://health.gov/sites/default/files/2020-01/DGA2000.pdf. [Google Scholar]
- 14. Crider KS, Bailey LB, Berry RJ. Folic acid food fortification—its history, effect, concerns and future directions. Nutrients. 2011;3:370–84.. doi:10.3390/nu3030370. [DOI] [PMC free article] [PubMed] [Google Scholar]
- 15. Dietrich M, Brown CJ, Block G. The effect of folate fortification of cereal-grain products on blood folate status, dietary folate intake, and dietary folate sources among adult non-supplement users in the United States. J Am Coll Nutr. 2005;24:266–74. [DOI] [PubMed] [Google Scholar]
- 16. O'Neil CE, Keast DR, Fulgoni VL, Nicklas TA. Food sources of energy and nutrients among adults in the US: NHANES 2003–2006. Nutrients. 4:2097–120. [DOI] [PMC free article] [PubMed] [Google Scholar]
- 17. Huth PJ, Keast DR, Park K, Auestad N. Major food sources of calories, added sugars, and saturated fat and their contribution to essential nutrient intakes in the U.S. diet: data from the National Health and Nutrition Examination Survey (2003–2006). Nutr J. 2013;12:116 doi:10.1186/1475-2891-12-116. [DOI] [PMC free article] [PubMed] [Google Scholar]
- 18. Reicks M, Jonnalagadda S, Albertson AM, Joshi N. Total dietary fiber intakes in the US population are related to whole grain consumption: results from the National Health and Nutrition Examination Survey 2009 to 2010. Nutr Res. 2014;34:226–34. [DOI] [PubMed] [Google Scholar]
- 19. Dietary Guidelines Advisory Committee Scientific report of the 2015 Dietary Guidelines Advisory Committee: advisory report to the Secretary of Health and Human Services and the Secretary of Agriculture. Washington (DC): USDA, Agricultural Research Service; 2015. [Google Scholar]
- 20. Barrett EM, Foster SI, Beck EJ. Whole grain and high-fibre grain foods: how do knowledge, perceptions and attitudes affect food choice?. Appetite. 2020;149:104630 doi:10.1016/j.appet.2020.104630. [DOI] [PubMed] [Google Scholar]
- 21. International Food Information Council 2019 food and health survey. [Internet] 2019; [accessed 2020 Feb 10]. Available from: https://foodinsight.org/wp-content/uploads/2019/05/IFIC-Foundation-2019-Food-and-Health-Report-FINAL.pdf. [Google Scholar]
- 22. McMackin E, Dean M, Woodside JV, McKinley MC. Whole grains and health: attitudes to whole grains against a prevailing background of increased marketing and promotion. Public Health Nutr. 2013;16:743–51. [DOI] [PMC free article] [PubMed] [Google Scholar]
- 23. Centers for Disease Control and Prevention Ten Great Public Health Achievements-United States, 2001-2010. MMWR. 2011;60:619–623. [PubMed] [Google Scholar]
- 24. US DA, Agricultural Research Service USDA food and nutrient database for dietary studies 2013–2014. [Internet] 2016; [accessed 2020 Jun 12]. Available from:http://www.ars.usda.gov/nea/bhnrc/fsrg. [Google Scholar]
- 25. USDA, Agricultural Research Service What We Eat in America, National Health and Nutrition Examination Survey overview, 2011–2014: data collection. [Internet] 2015; [accessed 2020 Jan 21]. Available from: https://www.ars.usda.gov/northeast-area/beltsville-md-bhnrc/beltsville-human-nutrition-research-center/food-surveys-research-group/docs/wweianhanes-overview. [Google Scholar]
- 26. Moshfegh AJ, Rhodes DG, Baer DJ, Murayi T, Clemens JC, Rumpler WV, Paul DR, Sebastian RS, Kuczynski KC, Ingwersen LA et al. . The USDA automated multiple-pass method reduces bias in the collection of energy intakes. Am J Clin Nutr. 2008;88:324–32. [DOI] [PubMed] [Google Scholar]
- 27. Tooze JA, Kipnis V, Buckman DW, Carroll RJ, Freedman LS, Guenther PM, Krebs-Smith SM, Subar AF, Dodd KW. A mixed-effects model approach for estimating the distribution of usual intake of nutrients: the NCI method. Stat Med. 2010;29(27):2857–68. [DOI] [PMC free article] [PubMed] [Google Scholar]
- 28. National Cancer Institute, Division of Cancer Control and Population Sciences Usual dietary intakes: The NCI method [Internet] 2020 [cited 2019 Dec 23]. Available from https://epi.grants.cancer.gov/diet/usualintakes/method.html. [Google Scholar]
- 29. Institute of Medicine Dietary reference intakes: applications in dietary assessment. Washington (DC): National Academies Press; 2000. [PubMed] [Google Scholar]
- 30. Newman JC, Malek AM, Hunt KJ, Marriott BP. Nutrients in the US diet: naturally occurring or enriched/fortified food and beverage sources, plus dietary supplements: NHANES 2009–2012. J Nutr. 2019;149:1404–12. [DOI] [PMC free article] [PubMed] [Google Scholar]
- 31. Fulgoni VL, Buckley RB. The contribution of fortified ready-to-eat cereal to vitamin and mineral intake in the U.S. population, NHANES 2007–2010. Nutrients. 2015;7:3949–58.. doi:10.3390/nu7063949. [DOI] [PMC free article] [PubMed] [Google Scholar]
- 32. Keast DR, Fulgoni VL, Nicklas TA, O'Neil CE. Food sources of energy and nutrients among children in the United States: National Health and Nutrition Examination Survey 2003–2006. Nutrients. 2013;5:283–301. [DOI] [PMC free article] [PubMed] [Google Scholar]
- 33. Dwyer JT, Fulgoni VL, Clemens RA, Schmidt DB, Freedman MR. Is “processed” a four-letter word? The role of processed foods in achieving dietary guidelines and nutrient recommendations. Adv Nutr. 2012;3:536–48. [DOI] [PMC free article] [PubMed] [Google Scholar]
- 34. Lockheart MS, Steffen LM, Rebnord HM, Fimreite RL, Ringstad J, Thelle DS, Pedersen JI, Jacobs DR Jr. Dietary patterns, food groups and myocardial infarction: a case–control study. Br J Nutr. 2007;98(2):380387. [DOI] [PubMed] [Google Scholar]
- 35. Sahyoun NR, Jacques PF, Zhang XL, Juan W, McKeown NM. Whole-grain intake is inversely associated with the metabolic syndrome and mortality in older adults. Am J Clin Nutr. 2006;83(1):124–31. [DOI] [PubMed] [Google Scholar]
- 36. Jacobs DR Jr, Meyer KA, Kushi LH, Folsom AR. Is whole grain intake associated with reduced total and cause-specific death rates in older women? The Iowa Women's Health Study. Am J Public Health. 1999;89(3):322–9. [DOI] [PMC free article] [PubMed] [Google Scholar]
- 37. Wu H, Flint AJ, Qi Q, van Dam RM, Sampson LA, Rimm EB, Holmes MD, Willett WC, Hu FB, Sun Q. Association between dietary whole grain intake and risk of mortality: two large prospective studies in US men and women. JAMA Intern Med. 2015;175(3):373–84. [DOI] [PMC free article] [PubMed] [Google Scholar]
- 38. Chen J, Huang Q, Shi W, Yang L, Chen J, Lan Q. Meta-analysis of the association between whole and refined grain consumption and stroke risk based on prospective cohort studies. Asia Pac J Public Health. 2016;28(7):563–75. [DOI] [PubMed] [Google Scholar]
- 39. Jacobs DR Jr, Meyer KA, Kushi LH, Folsom AR. Whole-grain intake may reduce the risk of ischemic heart disease death in postmenopausal women: the Iowa Women's Health Study. Am J Clin Nutr. 1998;68(2):248–57. [DOI] [PubMed] [Google Scholar]
- 40. Steffen LM, Jacobs DR Jr, Stevens J, Shahar E, Carithers T, Folsom AR. Associations of whole-grain, refined-grain, and fruit and vegetable consumption with risks of all-cause mortality and incident coronary artery disease and ischemic stroke: the Atherosclerosis Risk in Communities (ARIC) study. Am J Clin Nutr. 2003;78(3):383–90. [DOI] [PubMed] [Google Scholar]
- 41. Jacobs DR Jr, Andersen LF, Blomhoff R. Whole-grain consumption is associated with a reduced risk of non-cardiovascular, non-cancer death attributed to inflammatory diseases in the Iowa Women's Health Study. Am J Clin Nutr. 2007;85(6):1606–14. [DOI] [PubMed] [Google Scholar]
- 42. Liu S, Manson JE, Stampfer MJ, Hu FB, Giovannucci E, Colditz GA, Hennekens CH, Willett WC. A prospective study of whole-grain intake and risk of type 2 diabetes mellitus in US women. Am J Public Health. 2000;90(9):1409–15. [DOI] [PMC free article] [PubMed] [Google Scholar]
- 43. Fung TT, Hu FB, Pereira MA, Liu S, Stampfer MJ, Colditz GA, Willett WC. Whole-grain intake and the risk of type2 diabetes: a prospective study in men. Am J Clin Nutr. 2002;76(3):535–40. [DOI] [PubMed] [Google Scholar]
- 44. Aune D, Keum N, Giovannucci E, Fadnes LT, Boffetta P, Greenwood DC, Tonstad S, Vatten LJ, Riboli E, Norat T. Whole grain consumption and risk of cardiovascular disease, cancer, and all cause and cause specific mortality: systematic review and dose–response meta-analysis of prospective studies. BMJ. 2016;353:i2716. [DOI] [PMC free article] [PubMed] [Google Scholar]
- 45. Gaesser GA. Perspective: refined grains and health: genuine risk, or guilt by association?. Adv Nutr. 2019;10:361–71. [DOI] [PMC free article] [PubMed] [Google Scholar]
- 46. Gaesser GA. Carbohydrate quantity and quality in relation to body mass index. J Am Diet Assoc. 2007;107(10):1768–80. [DOI] [PubMed] [Google Scholar]
- 47. Williams PG. Evaluation of the evidence between consumption of refined grains and health outcomes. Nutr Rev. 2012;70(2):80–99. [DOI] [PubMed] [Google Scholar]
- 48. Williams PG, Grafenauer SJ, O'Shea JE. Cereal grains, legumes, and weight management: a comprehensive review of the scientific evidence. Nutr Rev. 2008;66(4):171–82. [DOI] [PubMed] [Google Scholar]
- 49. Bradlee ML, Singer MR, Qureshi MM, Moore LL. Food group intake and central obesity among children and adolescents in the Third National Health and Nutrition Examination Survey (NHANES III). Public Health Nutr. 2010;13(6):797–805. [DOI] [PubMed] [Google Scholar]
- 50. Koh-Banerjee P, Franz M, Sampson L, Liu S, Jacobs DR Jr, Spiegelman D, Willett WC, Rimm E. Changes in whole-grain, bran, and cereal fiber consumption in relation to 8-y weight gain among men. Am J Clin Nutr. 2004;80(5):1237–45. [DOI] [PubMed] [Google Scholar]
- 51. Bazzano LA, Song Y, Bubes V, Good CK, Manson JE, Liu S. Dietary intake of whole and refined grain breakfast cereals and weight gain in men. Obes Res. 2005;13(11):1952–60. [DOI] [PubMed] [Google Scholar]
- 52. McKeown NM, Yoshida M, Shea MK, Jacques PF, Lichtenstein AH, Rogers G, Booth SL, Saltzman E. Whole-grain intake and cereal fiber are associated with lower abdominal adiposity in older adults. J Nutr. 2009;139(10):1950–5. [DOI] [PMC free article] [PubMed] [Google Scholar]
- 53. Newby PK, Maras J, Bakun P, Muller D, Ferrucci L, Tucker KL. Intake of whole grains, refined grains, and cereal fiber measured with 7-d diet records and associations with risk factors for chronic disease. Am J Clin Nutr. 2007;86(6):1745–53. [DOI] [PMC free article] [PubMed] [Google Scholar]
- 54. Wang L, Gaziano JM, Liu S, Manson JE, Buring JE, Sesso HD. Whole and refined-grain intakes and the risk of hypertension in women. Am J Clin Nutr. 2007;86(2):472–9. [DOI] [PubMed] [Google Scholar]
- 55. Kasum CM, Nicodemus K, Harnack LJ, Jacobs DR Jr, Folsom AR; Iowa Women's Health Study . Whole grain intake and incident endometrial cancer: the Iowa Women's Health Study. Nutr Cancer. 2001;39(2):180–6. [DOI] [PubMed] [Google Scholar]
- 56. Liu S, Willett WC, Manson JE, Hu FB, Rosner B, Colditz G. Relation between changes in intakes of dietary fiber and grain products and changes in weight and development of obesity among middle-aged women. Am J Clin Nutr. 2003;78(5):920–7. [DOI] [PubMed] [Google Scholar]
- 57. McKeown NM, Troy LM, Jacques PF, Hoffmann U, O'Donnell CJ, Fox CS. Whole- and refined-grain intakes are differentially associated with abdominal visceral and subcutaneous adiposity in healthy adults: the Framingham Heart Study. Am J Clin Nutr. 2010;92(5):1165–71. [DOI] [PMC free article] [PubMed] [Google Scholar]
- 58. Esmaillzadeh A, Mirmiran P, Azizi F. Whole-grain intake and the prevalence of hypertriglyceridemic waist phenotype in Tehranian adults. Am J Clin Nutr. 2005;81(1):55–63. [DOI] [PubMed] [Google Scholar]
- 59. Masters RC, Liese AD, Haffner SM, Wagenknecht LE, Hanley AJ. Whole and refined grain intakes are related to inflammatory protein concentrations in human plasma. J Nutr. 2010;140(3):587–94. [DOI] [PMC free article] [PubMed] [Google Scholar]
- 60. McKeown NM, Troy LM, Jacques PF, Hoffmann U, O'Donnell CJ, Fox CS. Whole- and refined-grain intakes are differentially associated with abdominal visceral and subcutaneous adiposity in healthy adults: the Framingham Heart Study. Am J Clin Nutr. 2010;92(5):1165–71. [DOI] [PMC free article] [PubMed] [Google Scholar]


