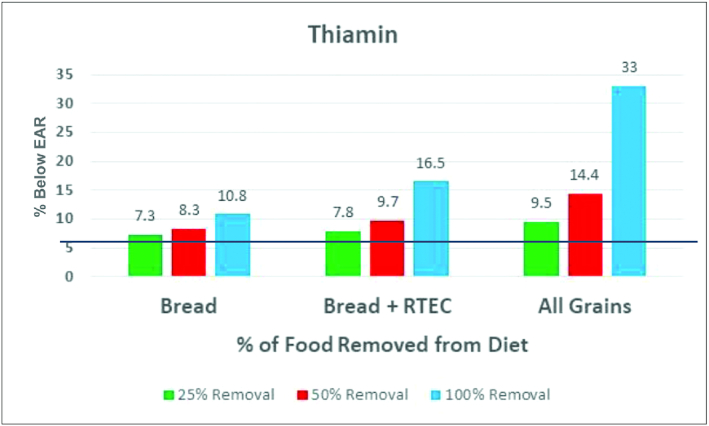
FIGURE 6.

Percentage of adults below the EAR for thiamin when select grain foods are removed from the current diet. Data are for adults aged ≥19 y; NHANES: 2009–2016. The black line represents the percentage of adults below the EAR for thiamin (6.5%). EAR, estimated average requirement; RTEC, ready-to-eat cereals.
