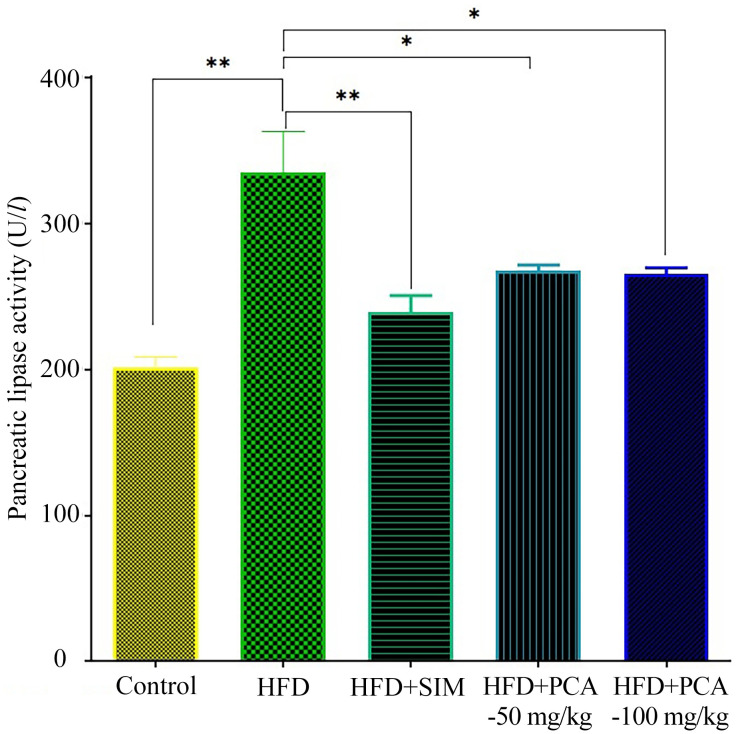
Fig. 1.
Levels of pancreatic lipase activity (U/l) in control and experimental groups of rats. Control group; HFD represents the group fed with high fat and fructose diet; SIM represents simvastatin; PCA50 mg/kg represents protocatechuic acid (PCA) at 50 mg/kg and PCA100 mg/kg represents protocatechuic acid at 100 mg/kg, respectively. Data are expressed at mean ± SEM of six rats in each group. *P<0.05; **P<0.01 indicate significant differences compared to the values of control and HFD, respectively.

