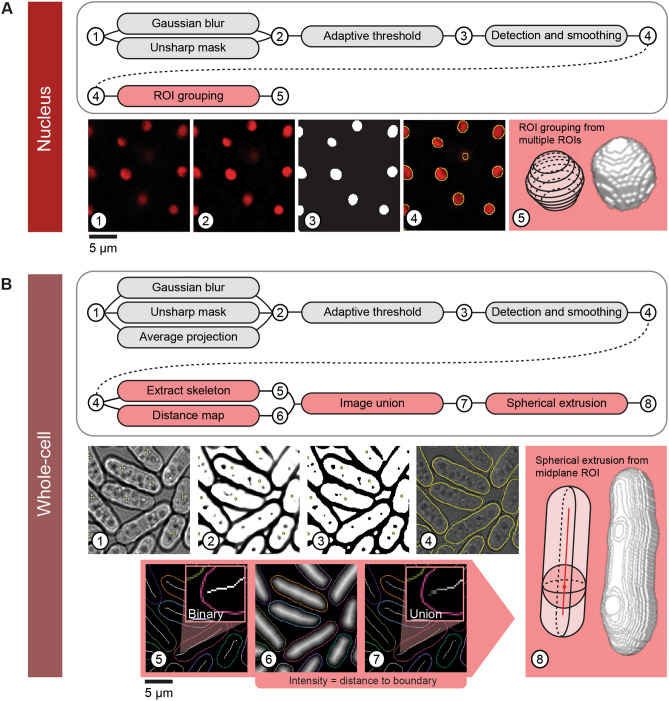
Figure 1.
Pomegranate pipeline schematic. (A) Nuclear segmentation and reconstruction—(top) schematic of processing steps for 2D nuclear segmentation (grey) and 3D reconstruction (red). (Bottom) Sequential images through the segmentation and reconstruction process: (1) sample slice of an input image, showing nuclear marker TetR-tdTomato-NLS, (2) sample slice of a processed input image following Gaussian blur and unsharp mask, (3) sample slice of a binary image from adaptive thresholding, (4) smoothed ROIs derived from binary image, (5) cartoon of reconstruction method and representative model from 3D reconstruction as a result of ROI grouping. (B) Whole-cell segmentation and reconstruction—(top) schematic of processing steps for 2D whole-cell segmentation (grey) and 3D reconstruction (red). (Bottom) Sequential images through the segmentation and reconstruction process: (1) sample slice of an input brightfield image with point selection on nuclear centroids from (A) (for the optional Z-alignment of whole-cell reconstructions to the corresponding nuclei), (2) Z-projection of multiple slices processed with Gaussian blur and unsharp mask, (3) binarization of projection, (4) smoothed ROIs derived from binary image (yellow) overlaid on brightfield image, (5) topological skeleton of binary image, (6) Euclidean distance map of binary, (7) union of topological skeleton and Euclidean distance map, used as radius profile input for spherical extrusion when generating the whole-cell 3D reconstruction, (8) cartoon of reconstruction method and representative model from 3D reconstruction as a result of spherical extrusion. For simplicity, extrusion is shown here along a straight axis, but topological skeletons are typically not straight (panels 5,7).

