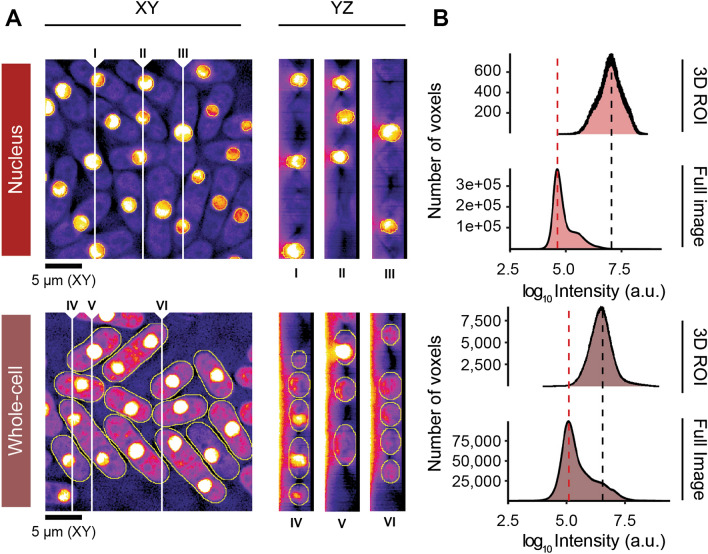
Figure 3.
Signal acquisition performance. (A) Representative optical sections in XY and three sample YZ orthogonal views at different X positions. White vertical lines indicate sampling positions for corresponding YZ orthogonal views. Voxel size is 0.1071 µm × 0.1071 µm × 0.065 µm. Images are from fission yeast expressing TetR-tdTomato-NLS and Mep33-mCherry for nuclear analysis (top) and TetR-tdTomato-NLS and Mep33-tdTomato for whole-cell analysis (bottom). Annotations provide minimum and maximum intensities. All images have been subject to gamma correction (γ = 0.50) to improve visibility of cytoplasmic signal. (B) Intensity histograms for all voxels in the image (full image), and for all voxels contained within the 3D ROIs. Dashed lines annotate maxima: background (red) and signal of interest (black).

