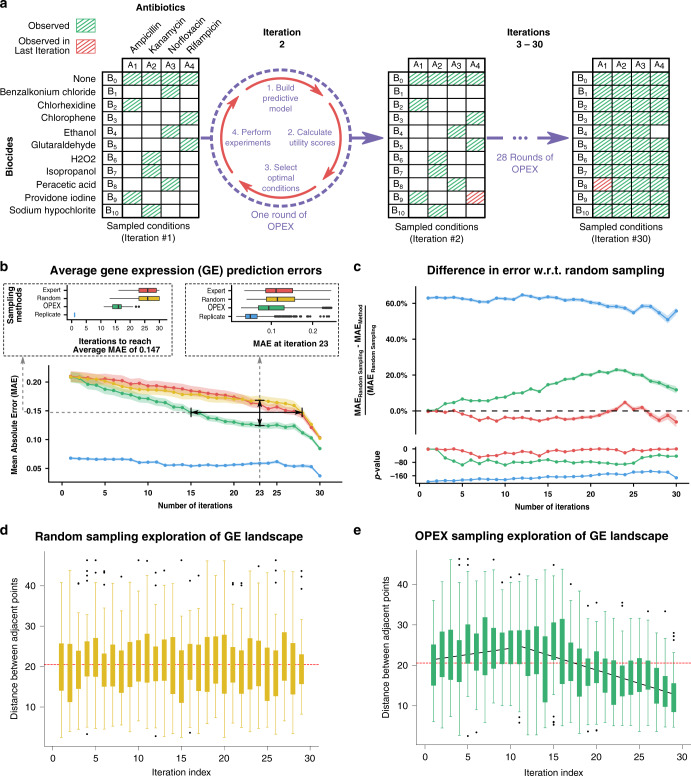
Fig. 2. OPEX applied to biocide–antibiotic experimental space.
a After 15 randomly sampled initial conditions, we performed 30 iterations (rounds) of OPEX, where at each iteration, the genome-wide transcriptional profile of E. coli is measured under a biocide–antibiotic combination. b Prediction error (MAE) for the remainder unobserved conditions at each iteration and for the three methodologies (Expert, Random, OPEX). Background envelop depicts the 95% confidence interval after 50 random initializations. Blue line depicts the variation in expression within the experimental replicates for each condition (three biological replicates). The boxplot on the top left shows the number of iterations necessary to reach a MAE of 0.15. The boxplot on the top right shows the MAE from each sampling method at iteration 23, where the gap between MAE of random sampling and OPEX is maximum. c The MAE difference and p value for each method with respect to random sampling. The p values were calculated by a one-sided paired t test (n = 1123). d, e The distance between the gene expression profiles of every two consecutively selected culture conditions by random sampling and OPEX, respectively. Each box in the boxplot shows the average distance for 50 random initializations. The red dashed line shows the median of the distances over all the iterations. Each box represents an interquartile range, which consists of data points between the 25th and 75th percentiles. The whiskers extend to the maximum and minimum values but no further than 1.5 times the interquartile range for a given whisker.

