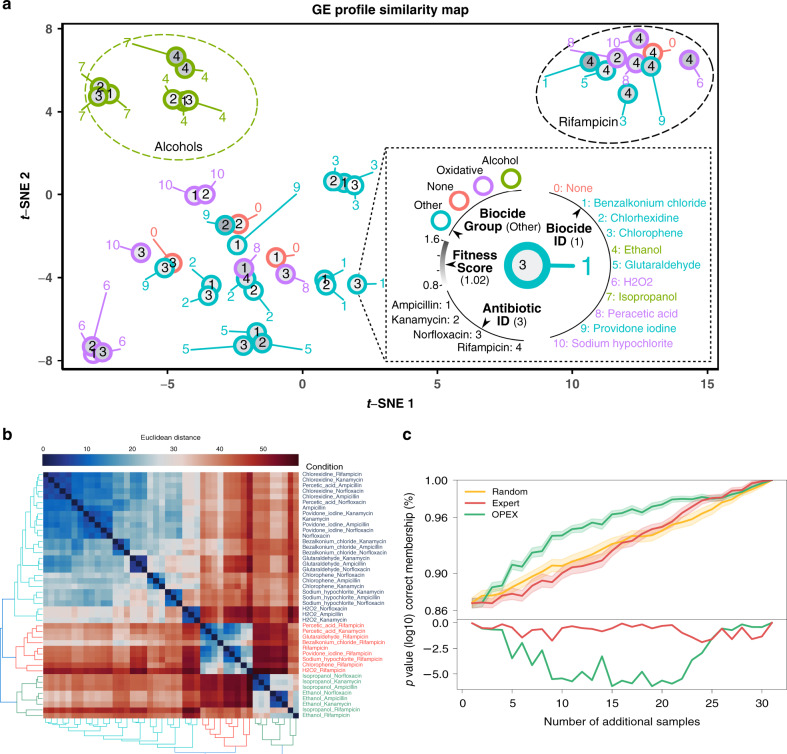
Fig. 3. OPEX accelerated the discovery of cluster memberships for the culture conditions.
a A two-dimensional representation of the gene expression profiles of all 44 culture conditions through t-SNE, where three clusters are observed (Rifampicin, Alcohols, and Others). Each bordered circle represents a culture condition, with the border color encoding the biocide group. The grayscale color of the inner circles encodes the fitness of E. coli under each condition. The numbers inside and outside each circle encode for the antibiotic and biocide, respectively. b Hierarchical clustering of culture conditions using the transcriptomic profiles for each culture condition. c Performance of OPEX in predicting cluster memberships. Starting with 15 observed culture conditions, OPEX predicts more accurately than other methods the gene expression phenotype of the remaining conditions and their respective clusters (Alcohols, Rifampicin, and Others), with p values being calculated with reference to random sampling. The shadow belt around a curve represents plus and minus standard deviation in 50 runs. The p values were calculated by a one-sided t test.

