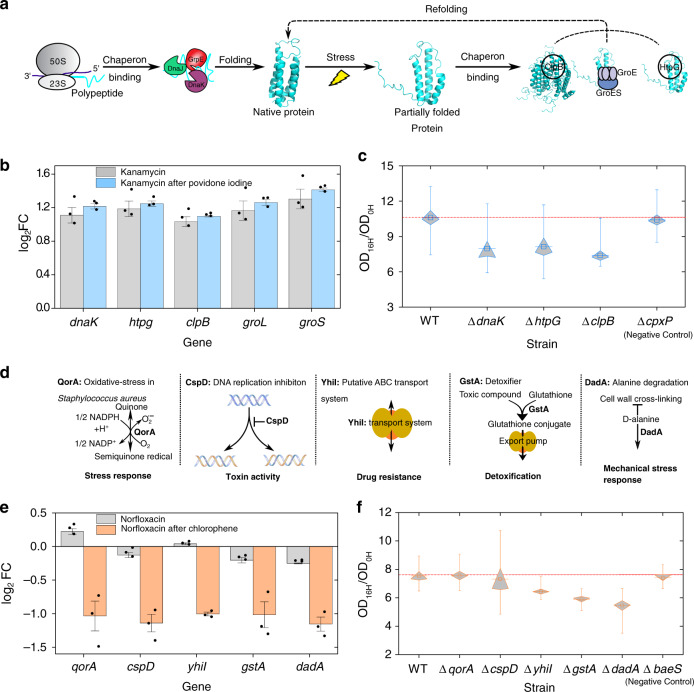
Fig. 5. The genetic basis of cross-stress behavior.
a The protein folding pathway and key proteins corresponding to genes that were found to be differentially expressed in the povidone-iodine/kanamycin combination, which exhibits the highest cross-protection across all cases (fitness increase of 65.1 ± 10.4%). b All differentially upregulated genes in the povidone-iodine/kanamycin combination, compared to kanamycin only, which have all been identified as chaperons (n = 3, biological replicates). c Fitness change of single knockout mutants in kanamycin for each differentially expressed chaperon. The red line denotes the fitness of WT; ΔdnaK, ΔhtpG, ΔclpB are the three differentially upregulated chaperons (p value of 0.007, 0.02, and 0.001, respectively); ΔcpxP is a non-differentially expressed chaperon used as a negative control (p value of 0.396, n = 9, biological replicates). d Differentially downregulated stress-related genes with more than twofold change exclusively in the chlorophene/norfloxacin combination, which exhibits the highest cross-vulnerability across all cases (fitness decreases by 13.4 ± 12.9%). e Expression profiles of potential genes involved in cross-vulnerability. (n = 3, biological replicates). f Fitness change of single knockout mutants, with yhil (p value = 0.004), gstA (p value = 0.007), and dadA (p value = 0.007) knockout mutants having a lower fitness than WT after norfloxacin exposure, supporting the cross-vulnerability due to chlorophene conditioning leading to downregulation. ΔbaeS (p value of 0.479) is a differentially expressed gene, which is involved in adaption to envelope stress, was used as a negative control (n = 8, biological replicates). Black circles in b and e represent raw data points. Boxes in c and f represent the standard error of the mean (SEM), the middle line represents the mean value, and the whisker line extends to the minimum and maximum values. An error bar represents an SEM. The p values were calculated by the one-sided Wilcoxon rank-sum test.

