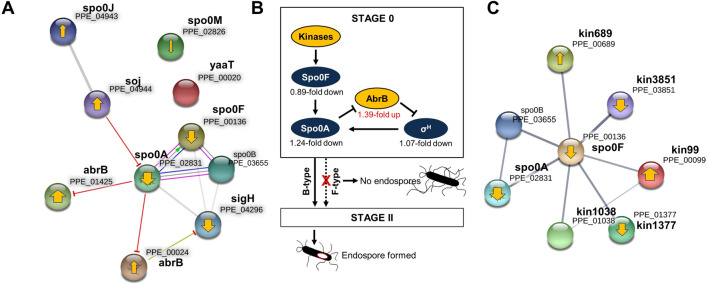
Figure 4.
Downregulation of sporulation-related genes in F-type cells and a proposed model for sporulation is regulated. (A) The interactions between the genes likely to be expressed in sporulation stage 0 and regulatory genes. The STRING map of proteins expressed in sporulation stage 0. Line shape indicates the predicted mode of action. The thickness of the yellow arrows in each node represents the log2 fold changes of each gene by RNA-seq. The upward-pointing arrow indicates upregulation and downward direction indicates downregulation in F-type. A circle without a yellow arrow indicates no difference in the amount of expression between B- and F-types. Blunt ended arrows represent negative interaction. (B) A simplified schematic representation of the regulatory network that governs the initiation of sporulation in E681. Yellow represents key regulators of Spo0A. (C) The interaction network between kinases and Spo0F in E681 based on string analysis is shown. Line thickness indicates the strength of data support.

