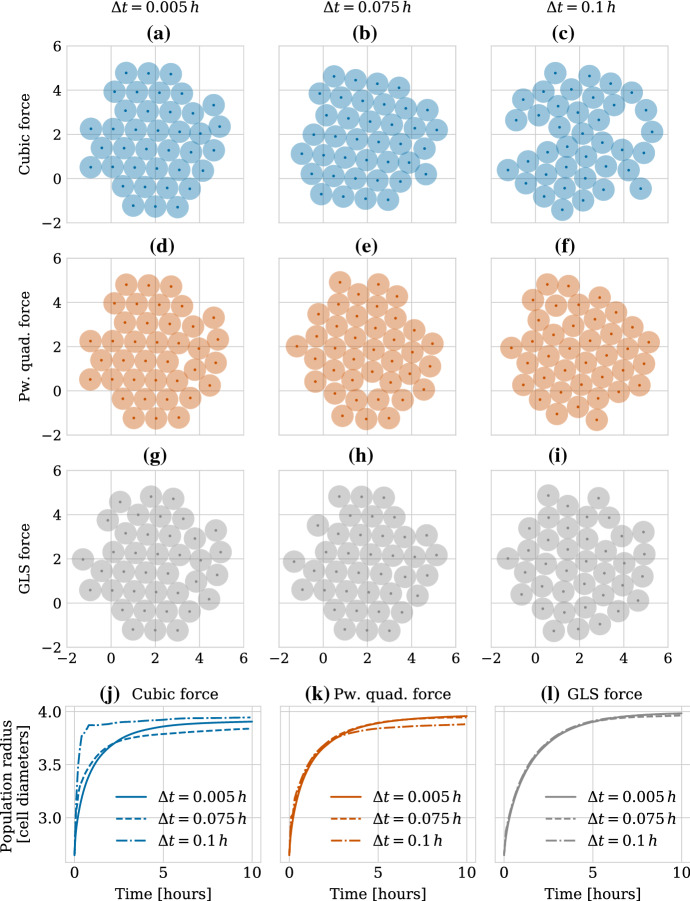
Fig. 12.
Impact of the time step size on the geometrical shape of a population and its radius. First row: 2D plots of a monolayer population simulated with the cubic force simulated for 10 h with the forward Euler method and different time step sizes, (a) , (b) and (c) . Second row: same set-up simulated with the piecewise quadratic force. Third row: same set-up simulated with the GLS force. All time step values lie within the stability region of the forward Euler method for all three force functions. The last row shows the radius of a monolayer population over time. Initially the population consisted of 19 cells arranged in a regular honeycomb pattern. All cells divided simultaneously once at the beginning of the simulation (cell division vectors were consistent across time steps and force functions due to the random seed being fixed). Then, the population was allowed to relax to a mechanical equilibrium configuration. Results are averaged over 10 simulation runs. The force function used was (j) the cubic force, (k) the piecewise quadratic force and (l) the GLS force

