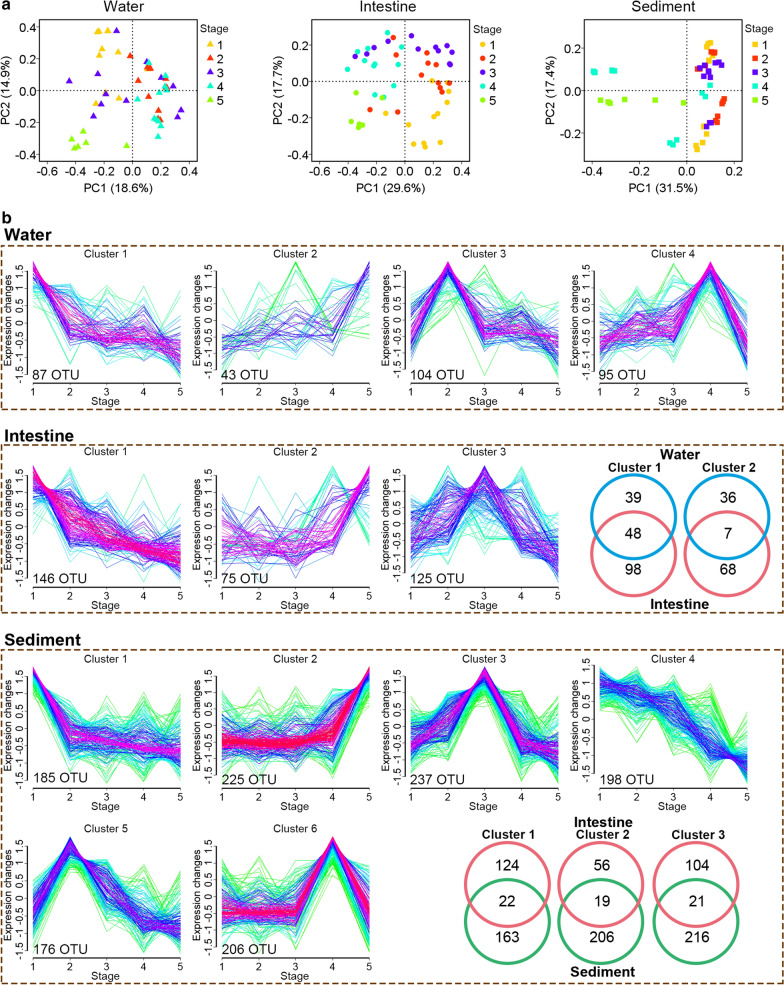
Fig. 4.
The altered microbial structure at different culture stages. a PCoA of the microbial structure at different culture stages. b OTUs with similar abundance alteration at different stages clustered into different groups. All the OTUs that were presented in more than 50% samples at each habitat were used for Mfuzz analysis. The x-axis represents culture stage, and the y-axis represents standardized expression change. OTUs in the same cluster suggested that their alteration trends during the culture period were similar. The Venn diagram showed the shared OTU number between similar clusters

