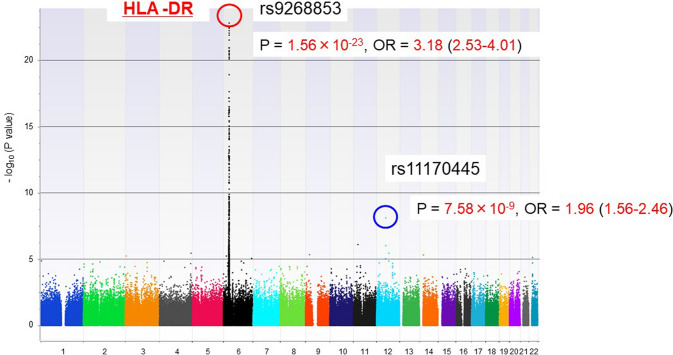
Fig. 3.
Manhattan plot presenting the P values across the genome. The -log10 P values from 426,851 SNPs in 257 fulminant type 1 diabetes case subjects and 419 control subjects plotted according to their physical positions on successive chromosomes. A top-hit SNP in the HLA region is circled in red. An SNP associated with fulminant type 1 diabetes with genome-wide significance outside the HLA region is circled in blue. Data based on Ref. [22]

