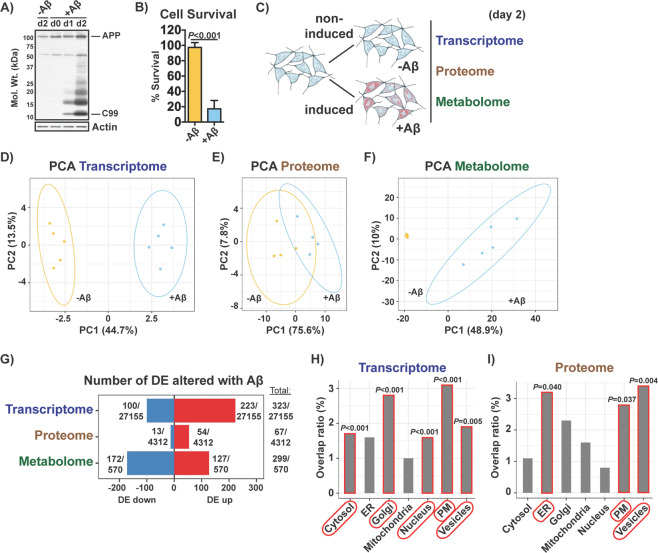
Fig. 1. Global effects of intracellular Aβ on the transcriptome, proteome and metabolome of MC65 nerve cells.
a Aβ aggregation in induced (+Aβ) MC65 nerve cells was confirmed by Western blotting at days 0, 1 and 2 and compared to non-induced (-Aβ) cells. Bars indicate C99 and full-length APP. b Cell survival was assayed on day 3. Unpaired two-tailed t-test (n = 3/group), data are mean ± SD. c Diagram illustrating the experimental approach. At day 2, non-induced (-Aβ) and induced (+Aβ) MC65 nerve cells were harvested for transcriptomic, proteomic and metabolomic analysis. PCA of the (d) top 500 most expressed genes (n = 5/group), (e) top 500 most expressed proteins (n = 4/group) and (f) total metabolites (n = 5/group). Ellipses show the 95% confidence interval of a t-distribution. Fold change levels and respective adjusted P values for all parameters can be found in supplementary Tables S1, S2 and S3. g Number of DE genes, DE proteins and DE metabolites upregulated (up) and downregulated (down) with Aβ. Number of total genes, proteins and metabolites detected/measured is indicated as the denominator. DE cutoff for the three parameters was FDR < 0.05 and absolute logFC > 0.5. Distribution of the (h) DE genes and (i) DE proteins per major subcellular compartment according to the Human Protein Atlas14. Overlap ratio is the number of DE genes or DE proteins found altered per total genes or proteins described to be present in a given compartment. P values calculated by 1000 bootstrap are indicated.

