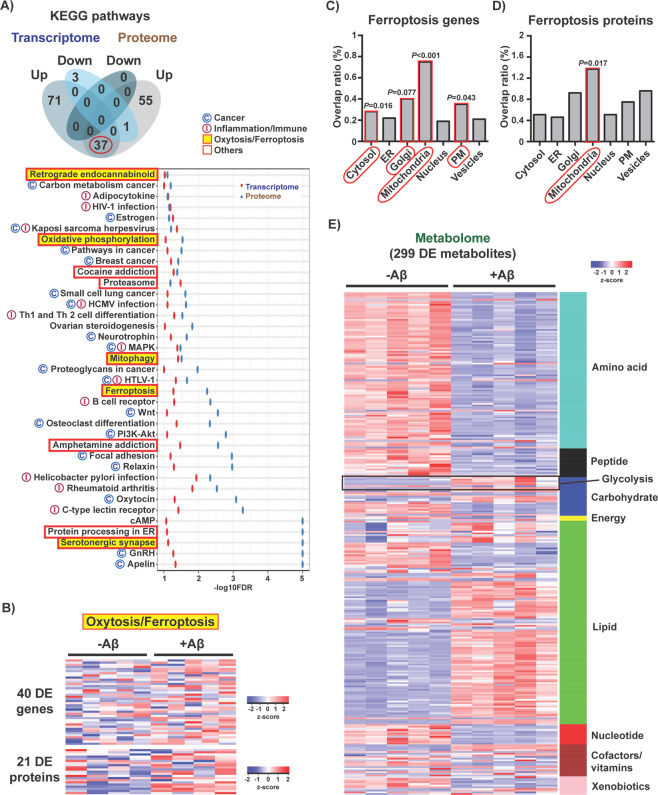
Fig. 2. Identification of the cellular pathways associated with Aβ toxicity.
a Venn diagram illustrating shared and uniquely affected KEGG pathways identified by GSEA that were upregulated (up) or downregulated (down) with Aβ. The red circle indicates the 37 KEGG pathways that were commonly altered in both transcriptomic and proteomic data. A list of those 37 pathways ordered by averaged enrichment score (-log10FDR) is shown. Pathways are grouped by biological process (cancer, inflammation/immune, oxytosis/ferroptosis and others). b Heatmap of the fold expression of the 40 DE genes (n = 5/group) and 21 DE proteins (n = 4/group) associated with the KEGG pathway ferroptosis. z-score = row-wise normalized log-transformed FPKM values for genes or batch-corrected log-transformed normalized average spectrum values for proteins. Distribution of the (c) 40 DE genes and (d) 21 DE proteins associated with ferroptosis per major subcellular compartment according to the Human Protein Atlas14. Overlap ratio is the number of DE genes or DE proteins found altered per total genes or proteins described to be present in a given compartment. P values calculated by 1000 bootstrap are indicated. e Heatmap of the 299 DE metabolites organized by biological class (n = 5/group). z-score = row-wise normalized Metabolon normalized imputed spectrum values.

