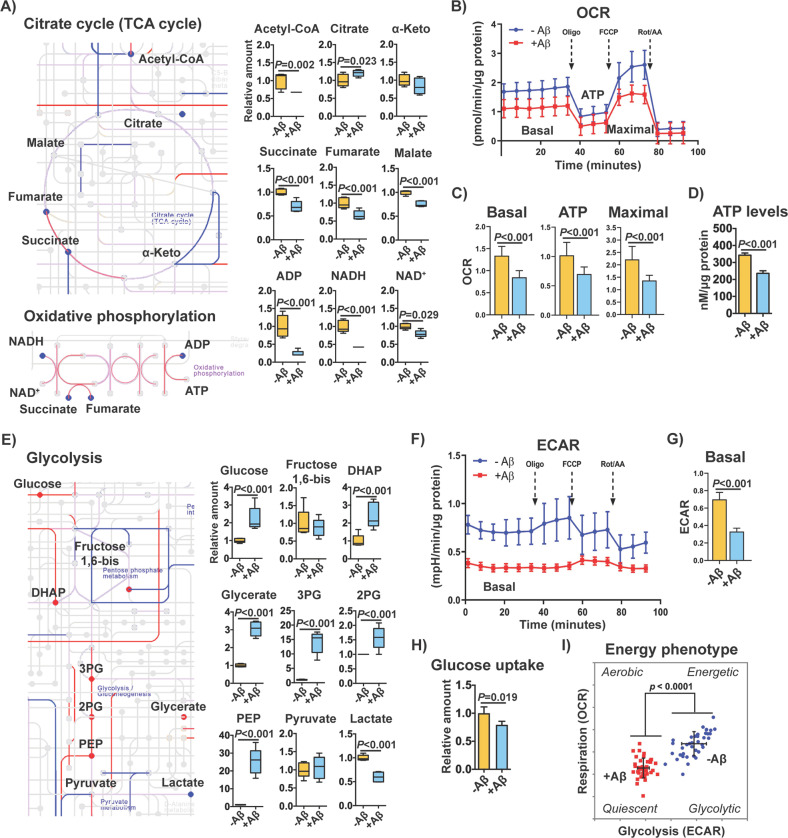
Fig. 3. Effects of intracellular Aβ on central carbohydrate metabolism.
a Extracts from the biochemical chart in Fig. S1 depicting the TCA cycle and oxidative phosphorylation biochemical pathways. Upregulated genes and proteins are shown in red lines, and downregulated genes and proteins in blue lines. The color is purple when genes and proteins did not show the same direction of change. Upregulated and downregulated metabolites are indicated in red and blue circles, respectively. DE cutoff for the three parameters was FDR < 0.05 and absolute logFC > 0.5. Graphs with levels of the different metabolites measured are also shown (n = 5/group). The metabolites citrate, malate and NAD+ had an absolute logFC < 0.5 but are also represented. b Mitochondrial oxygen consumption rates (OCR) in non-induced (-Aβ) and induced (+Aβ) MC65 nerve cells after 2 days. c The graphs for respective basal respiration, ATP production and maximal respiration are indicated. Unpaired two-tailed t-test (n = 40/group). d Total ATP levels in non-induced (-Aβ) and induced (+Aβ) MC65 nerve cells. Unpaired two-tailed t-test (n = 3/group). e Extract from Fig. S1 depicting the glycolysis biochemical pathway, with respective changes in genes, proteins and metabolites. DE cutoff for the three parameters was FDR < 0.05 and absolute logFC > 0.5. Graphs with levels of the glycolytic metabolites measured are shown (n = 5/group). f Extracellular acidification rate (ECAR) in MC65 nerve cells after 2 days of Aβ induction. g Basal ECAR. Unpaired two-tailed t-test (n = 40/group). h Glucose uptake at day 2 after Aβ induction. Unpaired two-tailed t-test (n = 4/group). i Cellular energy phenotype, determined by plotting the basal levels of OCR versus ECAR. Aerobic: cells rely predominantly in mitochondrial respiration. Glycolytic: cells utilize predominantly glycolysis. Energetic: cells utilize both metabolic pathways. Quiescent: cells are not very energetic via either metabolic pathway. All data are mean ± SD.

