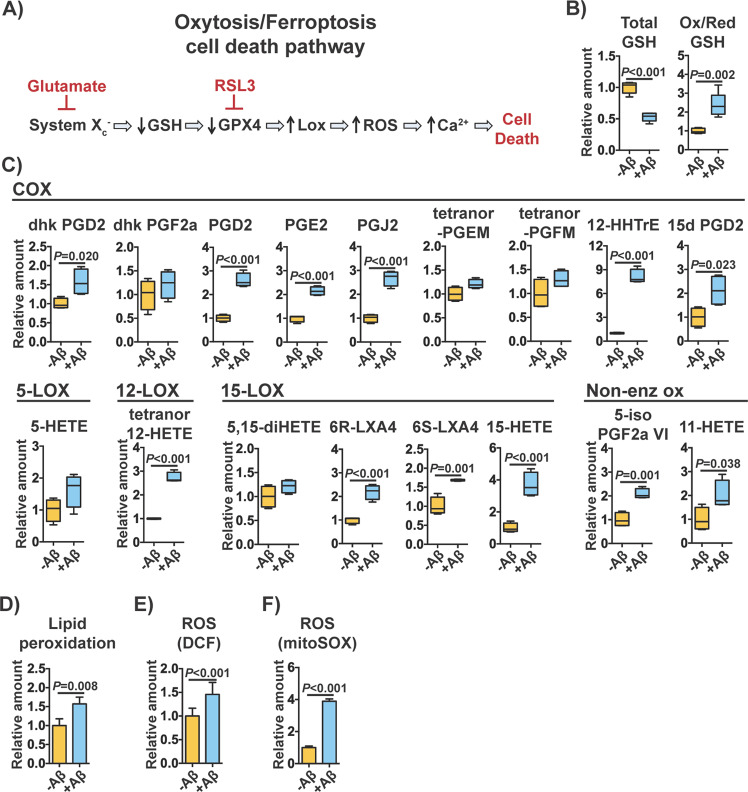
Fig. 4. Main features of oxytosis/ferroptosis in MC65 nerve cells exposed to Aβ toxicity.
a Diagram illustrating the molecular cascade characteristic of the oxytosis/ferroptosis cell death program. b Levels of total and oxidized/reduced GSH in MC65 nerve cells after 2 days of Aβ induction (n = 5/group). c Levels of eicosanoids derived from enzymatic (COX, 5-LOX, 12-LOX, 15-LOX) and non-enzymatic oxidation of AA measured at day 2. 13,14-dihydro-15-keto-prostaglandin D2 (dhk PGD2); 13,14-dihydro-15-keto-prostaglandin F2 alpha (dhk PGF2a); prostaglandin D2 (PGD2); prostaglandin E2 (PGE2); prostaglandin J2 (PGJ2); tetranor-prostaglandin EM (tetranor-PGEM); tetranor-prostaglandin EM (tetranor-PGFM); 12-hydroxyheptadecatrenoic acid (12-HHTrE); 15-deoxy-delta 12,14-prostaglandins D2 (15d PGD2); (5-HETE); tetranor-12-hydroxyeicosatetraenoic acid (tetranor 12-HETE); 5,15-dihydroxyeicosatetraenoic acid (5,15-diHETE); 6R-lipoxin A4 (6R-LXA4); 6S-lipoxin A4 (6S-LXA4); 15-hydroxyeicosatetraenoic acid (15-HETE); prostaglandin F2 alpha VI (5-iso PGF2aVI); 11-hydroxyeicosatetraenoic acid (11-HETE). Unpaired two-tailed t-test (n = 4/group). d Global lipid peroxidation at day 2. Unpaired two-tailed t-test (n = 3–4/group). e Whole cell ROS production at day 2. Unpaired two-tailed t-test (n = 11/group). f Mitochondrial superoxide production day 2. Unpaired two-tailed t-test (n = 3/group). All data are mean ± SD.

