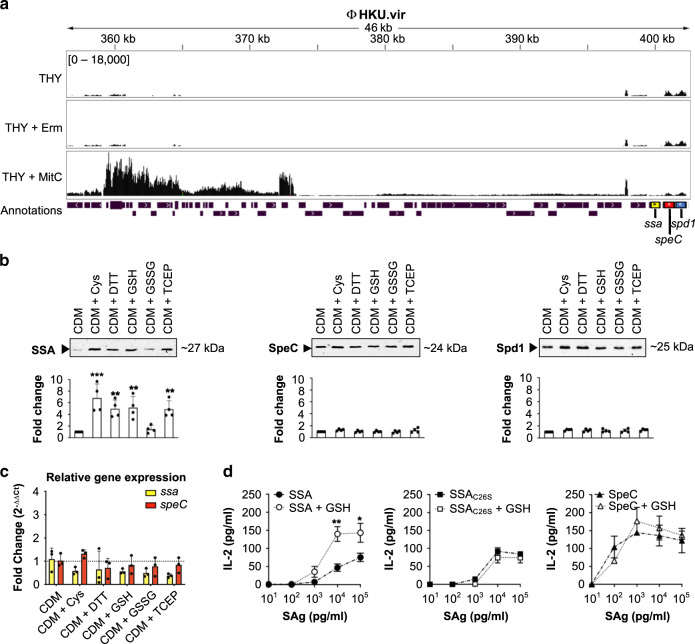
Fig. 1. Post-transcriptional thiol-based regulation of SSA.
a RNAseq expression profile of ΦHKU.vir in the macrolide- and tetracycline-resistant GAS emm12 isolate HKU16, grown in THY broth with sub-inhibitory concentrations of erythromycin (Erm) and mitomycin C (MitC). The plots illustrate the overall coverage distribution displaying the total number of sequenced reads. The region that encodes exotoxin genes (ssa in yellow, speC in red, and spd1 in blue) is indicated. b Immunoblot detection of SSA, SpeC, and Spd1 in culture supernatants of HKU16 grown in a chemically defined medium (CDM) in the presence of various redox-active compounds. Western blot signal intensities were quantified with ImageJ. Data are presented as mean values ± SD. Statistical significance was assessed using one-way ANOVA with Dunnett’s multiple comparisons post hoc test against the CDM control group (***p < 0.001 for CDM + Cys, **p = 0.008 for CDM + DTT, **p = 0.006 for CDM + GSH, and **p = 0.01 for CDM + TCEP) (n = 4). c Quantitative real-time PCR of ssa and speC transcripts in HKU16 grown in CDM treated with 2 mM of the indicated redox-active compounds. Data from three biological replicates are presented as mean values ± SD. d Superantigen (SAg) activation of human T cells with SSA (circular), SSAC26S (square), and SpeC (triangular) at the indicated concentrations in absence (black; dash-dot line) or presence of 2 mM of GSH (white; dotted line), using human IL-2 as a readout. Results are expressed as the mean ± SEM from three independent experiments from one representative donor (out of three independent donors). Statistical significance was assessed by two-tailed unpaired Student’s t test (**p = 0.0062 for SSA + GSH at a Sag concentration of 104 pgmL−1, and *p = 0.0306 for SSA + GSH at a Sag concentration of 105 pg mL−1). Source data are provided as a Source Data file.

