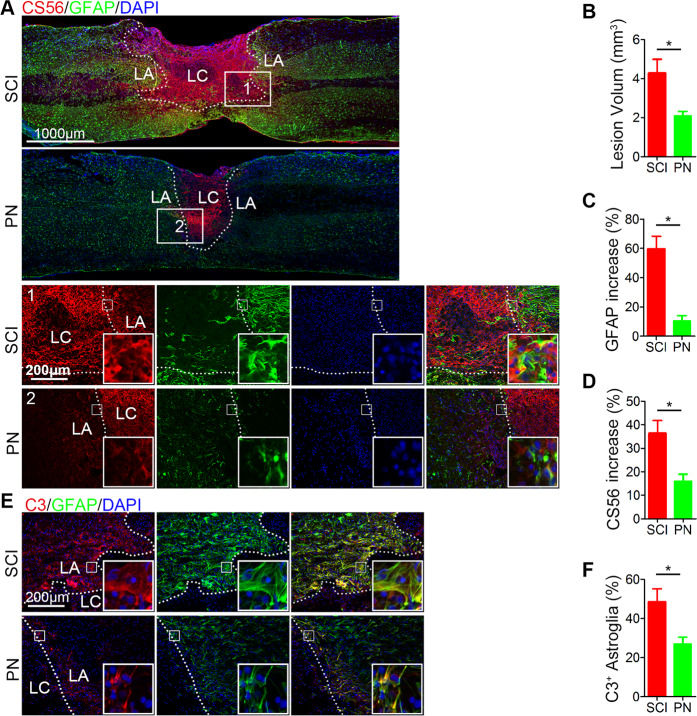
Fig. 3. PN inhibited the formation of astrocyte scar, reduced the production of CSPG and attenuated the activation of A1 astrocytes after SCI.
a Representative images of CSPG detected by CS56 (red) and GFAP (green) immunohistochemical staining on day 14 after injury in spinal cord lesion areas. Two columns (1, and 2 respectively represent SCI group and PN group) are the enlarged images of the area around the damage boundary. The cavity boundary is indicated by the dashed lines. All cell nuclei were counterstained with DAPI (blue). Scale bar, 1000 μm (upper) and 200 μm (below). b Quantitative analysis of lesion volume according to GFAP-positive scar (a) in the two groups. c, d Semiquantification of CS56 and GFAP intensity increase in (a). e Representative images of C3 (red) and GFAP (green) immunohistochemical staining on day 14 after injury in the two groups. All cell nuclei were counterstained with DAPI (blue). Scale bar, 200 μm. f Quantitative analysis of the ratio of C3+/GFAP+ cells in the lesion in (e). LA, lesion core; LA, lesion adjacent. All data are presented as means ± SEM (n = 5 mice per group). *P < 0.05.

