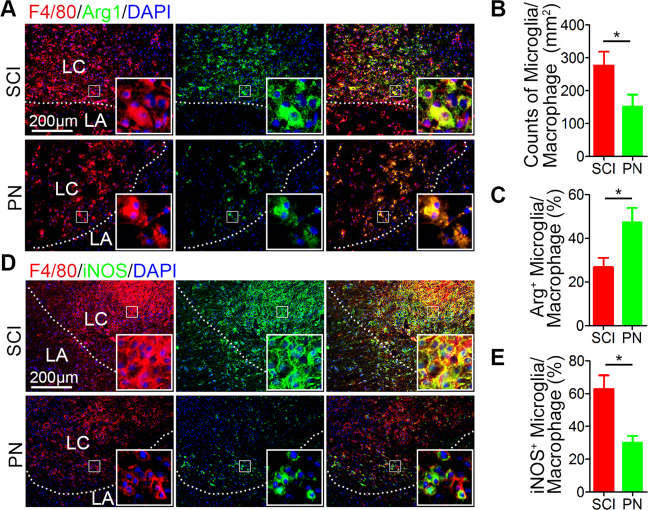
Fig. 4. PN inhibited microglia infiltration and shifted M1/M2 polarization after SCI.
a Representative images of F4/80 (red) and Arg1 (green) immunohistochemical staining on day 7 after injury in spinal cord lesion areas. The cavity boundary is indicated by the dashed lines. All cell nuclei were counterstained with DAPI (blue). Scale bar, 200 μm. b, c Quantitative analysis of the number of F4/80+ microglia/macrophages and the ratio of Arg1+/F4/80+ microglia/macrophages in the lesion in (a). d Representative images of F4/80 (red) and iNOS (green) immunohistochemical staining on day 7 after injury in spinal cord lesion areas. The cavity boundary is indicated by the dashed lines. All cell nuclei were counterstained with DAPI (blue). Scale bar, 200 μm. e Quantitative analysis of the ratio of iNOS+/F4/80+ microglia/macrophages in the lesion in d. LA, lesion core; LA, lesion adjacent. All data are presented as means ± SEM (n = 5 mice per group). *P < 0.05.

