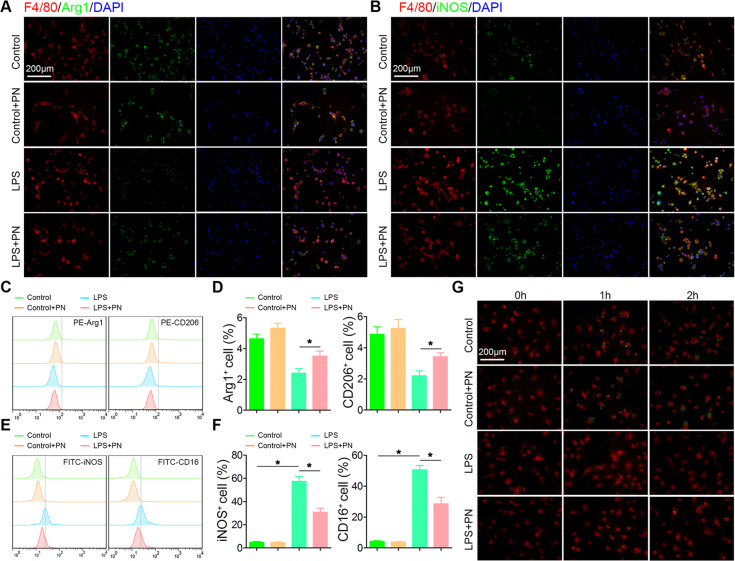
Fig. 6. PN inhibited M1 phenotype in BV2 cells in vitro.
a, b Representative images of F4/80 (red) and Arg1/iNOS(green) immunohistochemical staining of BV2 cells under LPS stimulation for 24 h in the presence or absence of PN (1 μM). (n = 6/group). All cell nuclei were counterstained with DAPI (blue). Scale bar, 200 μm. c, e Representative flow cytometry histograms of Arg1+, CD206+, iNOS+, or CD16+ BV2 cells under the same stimulation previously described in a. d, f Semi-quantitative analysis of Arg1+, CD206+, iNOS+, or CD16+ BV2 cells in c, e. (n = 6/group). All data are presented as means ± SEM. *P < 0.05. g Representative images of phagocytosis of pHrodo-Green-dye–labeled C. albicansin BV2 cells stained with F4/80 (red) followed the time course. (n = 6/group). Scale bar, 200 μm.

