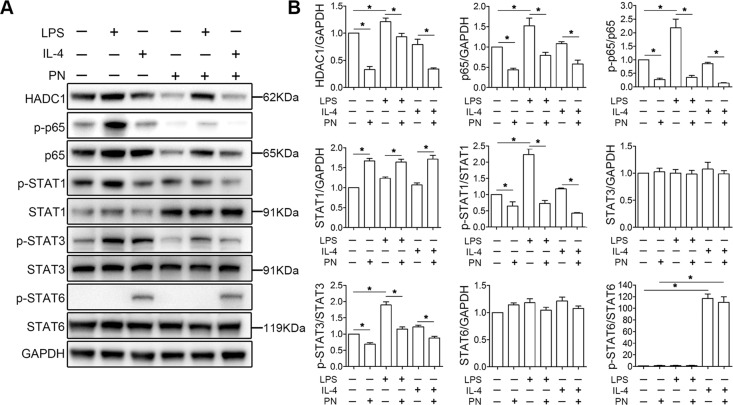
Fig. 7. PN inhibited the expression of HDAC1, and suppressed NF-κB and STAT1/3 signal pathways.
a Representative western blot band showed the levels of total protein (HDAC1, p65, STAT1, STAT3, and STAT6) and phosphorylated protein for the indicated molecules (p65, STAT1, STAT3, and STAT6) in BV2 cells under LPS or IL-4 stimulation for 24 h in the presence or absence of PN (1 μM). b Semi-quantitative analysis of the levels of total protein (HDAC1, p65, STAT1, STAT3, and STAT6) and phosphorylated protein for the indicated molecules (p65, STAT1, STAT3, and STAT6) in a, which were quantified and normalized to GAPDH. (n = 4/group). All data are presented as means ± SEM. *P < 0.05.

