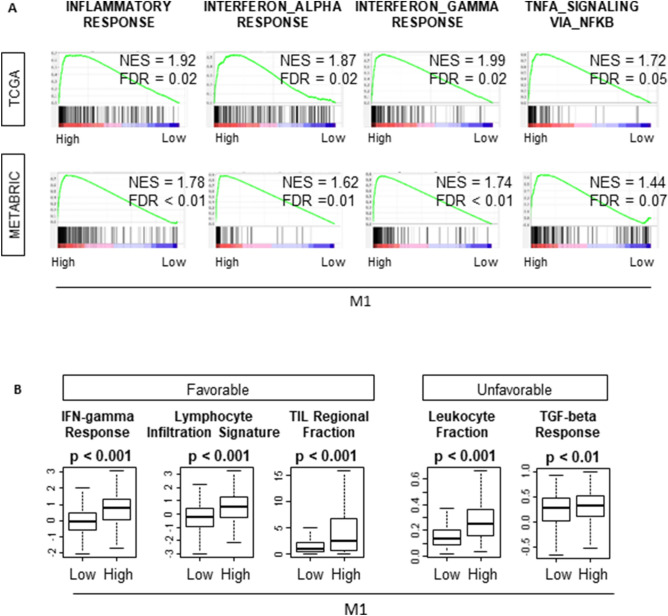
Figure 5.
“M1” high tumors enriched the immune associated gene sets and demonstrated higher immune activity related scores. (A) “M1” high tumors enriched the gene sets related immune activity. (B) High infiltration of “M1” was associated with higher score of both favorable and unfavorable immune activity related scores. TCGA (n = 1065, High = 533, Low = 532). METABRIC (n = 1903, High = 953, Low = 950). The statistical significance of GSEA was determined using false discovery rate (FDR) of 0.25.

