Figure 1.
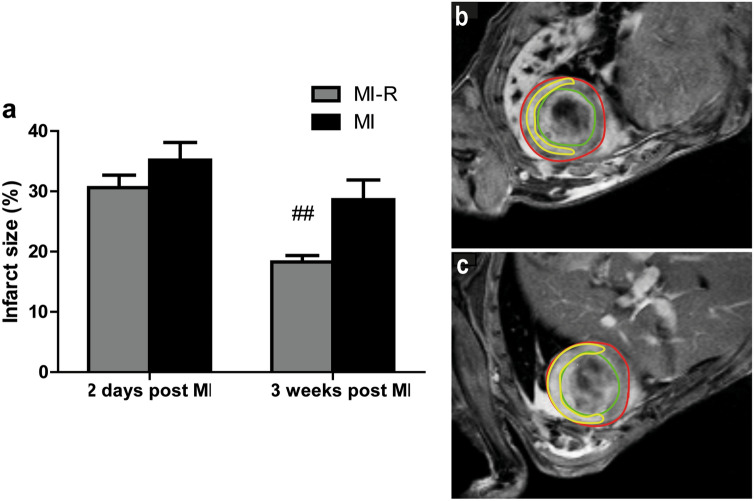
Contrast-enhanced MR imaging. After 2 days no significant difference in infarct size was observed between the MI and MI-R group. However, after 3 weeks the MI group displayed a significant increased infarct size as compared to the MI-R group (a; n = 15–16 per group). Typical example of contrast-enhanced MR image 2 days following non-transmural MI-R (b) and transmural MI (c). Red line indicates epicardial border, green line indicates endocardial border and yellow line indicates infarct area. Individual data points are presented in Supplemental Fig. S1. Data are mean ± SEM. ##p < 0.01 versus MI.

