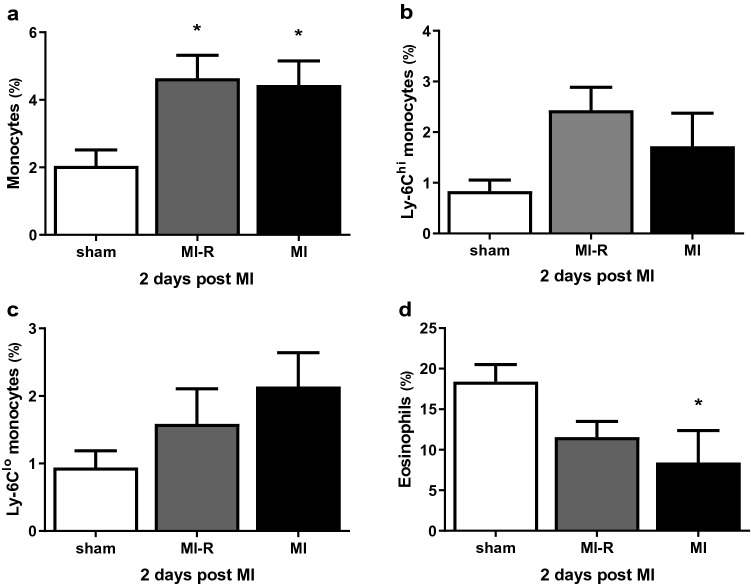
Figure 4.
Systemic inflammatory response. FACS analysis after 2 days (n = 5–8 per group) showed increased levels of circulating monocytes in both the MI-R and MI group as compared to sham (a) with a different distribution pattern of Ly-6Chi and Ly-6Clo monocytes in both groups (b and c). Circulating eosinophils were obviously decreased in both the MI-R and MI group compared to sham (d). Individual data points are presented in Supplemental Fig. S4. Data are mean ± SEM. *p < 0.05 versus sham.

