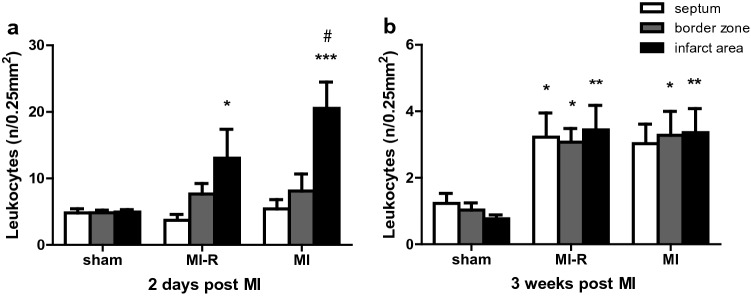
Figure 5.
Local inflammatory response. Both MI-R and MI resulted in an increased number of infiltrated leukocytes 3 weeks after infarction as compared to sham (b; n = 9–10 per group). After 2 days numbers of local infiltrated leukocytes in the infarct area were higher in the MI group compared to the MI-R group (a; n = 5 per group). Individual data points are presented in Supplemental Fig. S5 Data are mean ± SEM. #p < 0.05 versus MI-R; *p < 0.05, **p < 0.01, ***p < 0.001 all versus sham.

