
Figure 3.
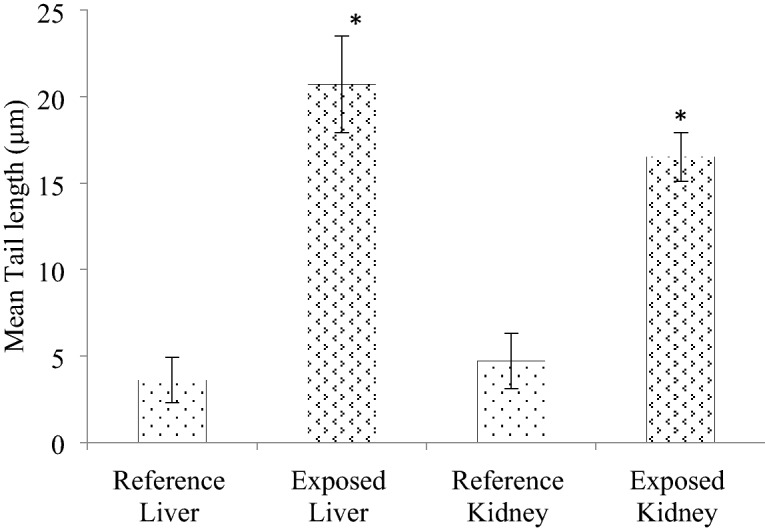
The effects of heavy metals on DNA damage in reference and exposed O. niloticus liver and kidney tissues. Data represented mean ± SEM, (n = 6); t-test was used for statistical analysis and level of significance established at p < 0.05.
Official websites use .gov
A
.gov website belongs to an official
government organization in the United States.
Secure .gov websites use HTTPS
A lock (
) or https:// means you've safely
connected to the .gov website. Share sensitive
information only on official, secure websites.
The effects of heavy metals on DNA damage in reference and exposed O. niloticus liver and kidney tissues. Data represented mean ± SEM, (n = 6); t-test was used for statistical analysis and level of significance established at p < 0.05.