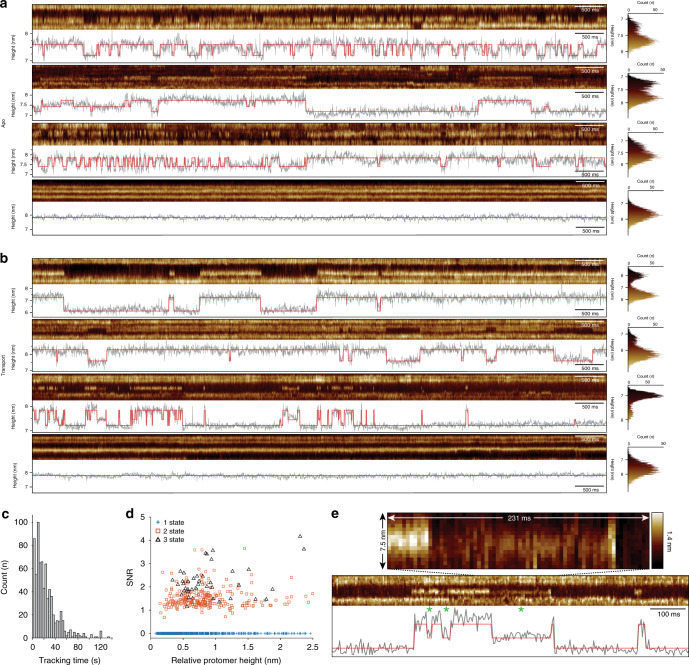
Fig. 3. Elevator dynamics of single unlabeled GltPh transporter domains.
HS-AFM-LS raw data kymographs and height/time traces recorded in apo a and transport b conditions. All kymographs were recorded at 3.3 ms line acquisition speed. The height/time traces (gray) report the movements of the protomer in the center of the kymograph and are overlaid by the state-transition trace (red). The last kymograph and height/time trace in each condition shows traces of inactive protomers (see Table S2). Right: height distributions of the protomers under investigation. c Length distribution of GltPh transport domain tracking in HS-AFM-LS experiments (n = 762). d Signal-to-noise ratio (SNR) plotted against the protomer relative height over membrane in the outward-facing state for all analyzed 762 individual protomers. Traces assigned with 1, 2, and 3 amplitude states are represented by blue crosses, red squares, and black triangles, respectively. e A representative raw data kymograph and height/time trace (gray) overlaid by the idealized state-transition trace (red) of a transport domain visiting three states. Asterisks indicate intermediate state intervals. Top: pixel-by-pixel display of 7.5 nm lateral dimension and 231 ms raw data of the center (dashed lines) of the 3-state kymograph shown below, allowing the viewer to observe the SNR and pixel-statistics of HS-AFM-LS. The full false color scale of the pixels shown is 1.4 nm.

