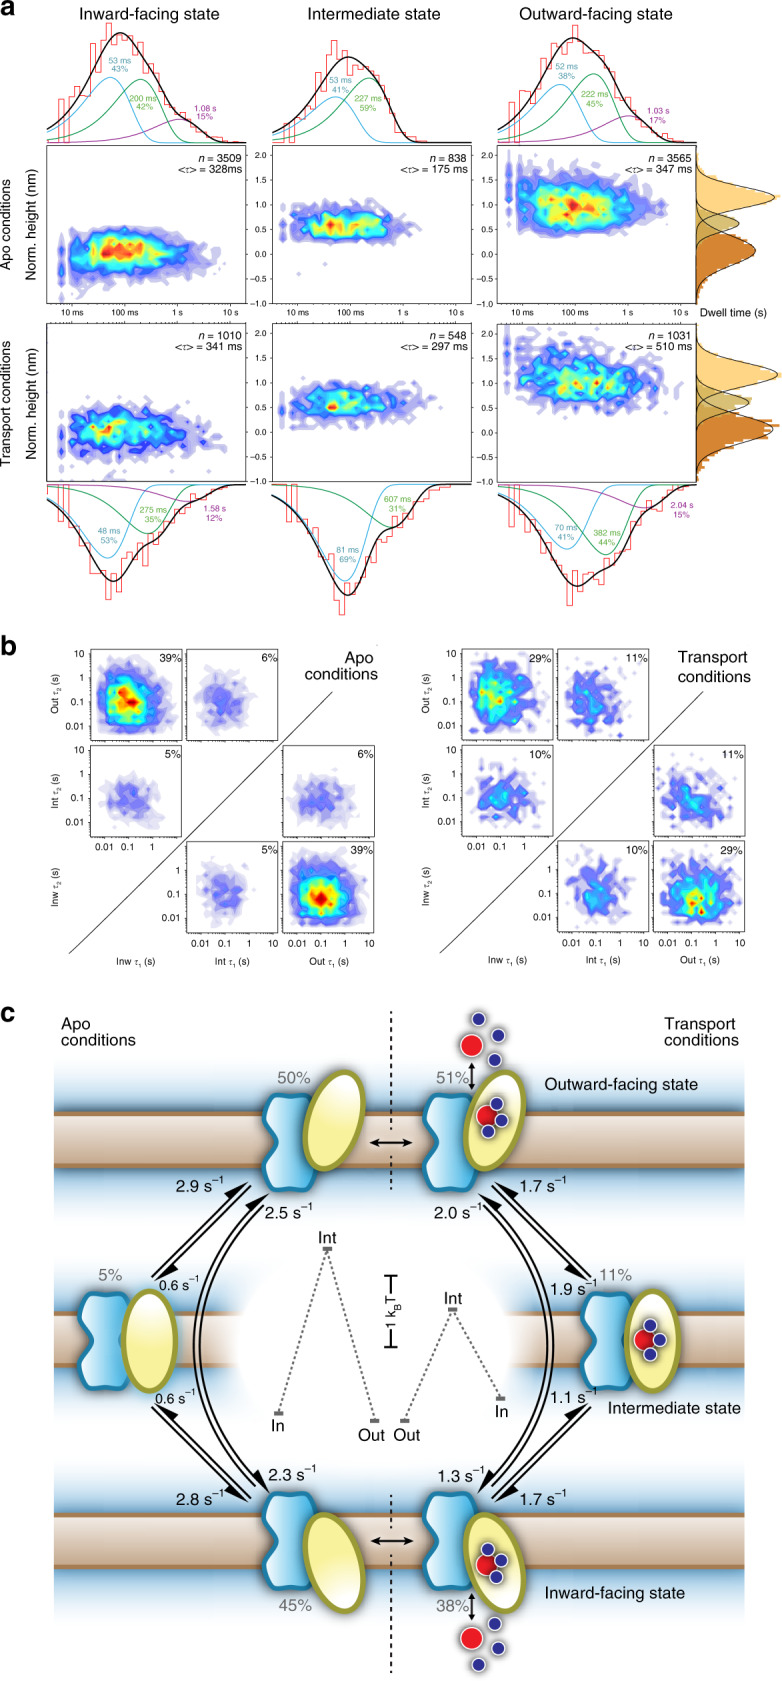
Fig. 4. Dynamics of the GltPh transport cycle.

a Density maps of dwell-times vs height of transport domains in the absence and presence of substrates, i.e. apo (top) and transport (bottom) conditions: inward- (left), intermediate (middle), and outward- (right) facing state dwell-times. All density maps and histograms (above and below the density maps) were logarithmically binned. The dwell-time histograms were fitted (black) with multiple exponential components (blue, green, and purple) and the corresponding exponential decay values and occurrence percentages are indicated. The transporter domain height distributions (far right) are well fitted by Gaussians. The total number of transitions (n) and the average dwell-times (<τ>) are indicated in the tope right of each panel. b State-transition tiles in apo (left) and transport (right) conditions, where the initial state and the final state are plotted on the x- and y-axis, respectively. Inside the tiles: density maps of the initial- vs the final- dwell-time of each transition. c Schematic representation of the GltPh transport cycle. HS-AFM-LS characterizes the membrane transitions in either apo- or transport conditions in independent experiments (separated by the black dashed line). Only a single trimerization domain (blue) and transport domain (yellow) are shown. Arrows indicate transport domain pathways. The numbers next to each arrow indicate the weighted rate constants (see “Methods”) from one state to another. The percentages next to each state indicate the mean occupancy (see “Methods”) of each state, from which the energy landscapes (central inset) are calculated (note 1: the energy barriers between states are not determined; note 2: the energy landscape only describes the dynamic protomers). Asp (red dot) and Na+ (blue dots) associate and dissociate to/from the transport domain on either side of the membrane.
