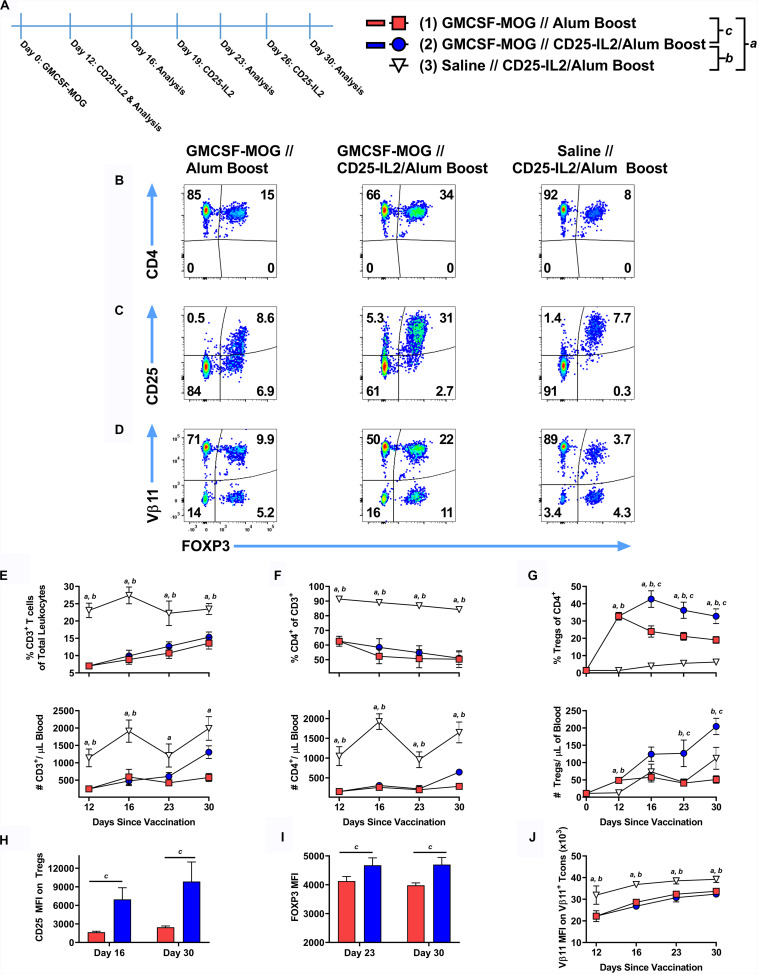
FIGURE 11.
After tolerogenic vaccination, boosting with CD25-IL2/Alum maintained Treg responses in vivo. On day 0, 2D2-FIG mice were subcutaneously vaccinated with 4 nmoles of the tolerogenic vaccine GMCSF-MOG (in saline) or saline alone. On days 12, 19, and 26, mice were boosted with either saline in Alum or 3 nmoles CD25-IL2 in Alum (n = 6–8/group). PBMCs were assayed for CD3, CD4, GFP (FOXP3), CD25, and Vβ11 by flow cytometry on days 12, 16, 23, and 30. Shown (A) is a timeline of the boosting schedule and the PBMC analysis. Shown are representative dot plots (day 30 time-point) from each treatment group gated on CD3+ CD4+ T cells and analyzed for (B) CD4, (C) CD25, and (D) Vβ11 and FOXP3 expression. Shown are the percentages (top row) and total numbers (bottom row) of (E) CD3+ T cells, (F) CD4+ T cells (CD3+ gate), and (G) FOXP3+ Tregs (CD3+ CD4+ gate) on days 12, 16, 23, and 30 time-points. (H) The CD25 MFIs on the CD3+ CD4+ FOXP3+ Tregs are shown for the day 16 and 30 time-points. (I) The FOXP3 MFIs on the CD3+ CD4+ FOXP3+ Tregs are shown for the day 23 and 30 time-points. (J) The TCR-Vβ11 MFIs are shown for CD3+ CD4+ Vβ11+ FOXP3– Tcon cells. Statistical significance was analyzed by use of a one-way ANOVA with the Holm-Sidak multiple comparisons test. Statistically significant (p < 0.05) differences were noted as indicated (a, 1 vs 3), (b, 2 vs 3), (c, 1 vs 2). Error bars represent SEM.

