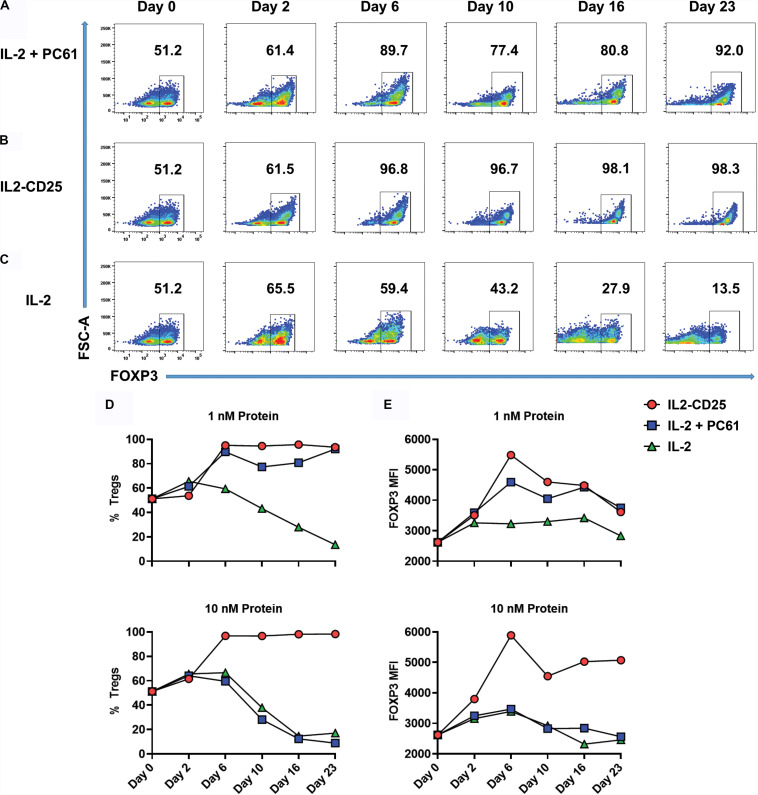
FIGURE 6.
IL2-CD25 enabled dominance of FOXP3+ Treg lines during continuous culture. 2D2-FIG SPLs were activated at a density of 2 × 10⁶ cells/ml in complete RPMI medium with 1 μM MOG35-55 and 10 nM TGF-β. After 3 days of activation, cells were passaged (designed day 0) at a density of 106 cells/ml with 1 nM mouse IL-2 and 10 μg/ml PC61 (A), 10 nM IL2-CD25 (B), or 1 nM mouse IL-2 (C). Cells were passaged in these conditions every 3–4 days and were analyzed for percentages of CD4+ FOXP3+ T cells on designated days. Shown are the percentages of CD4+ FOXP3+ Tregs (D) and the FOXP3 MFI (CD4+ FOXP3+ gate) (E) when propagated with 1 nM (top) or 10 nM (bottom) of IL-2 or IL2-CD25 (PC61 = 10 μg/ml). These data represent three independent experiments.

