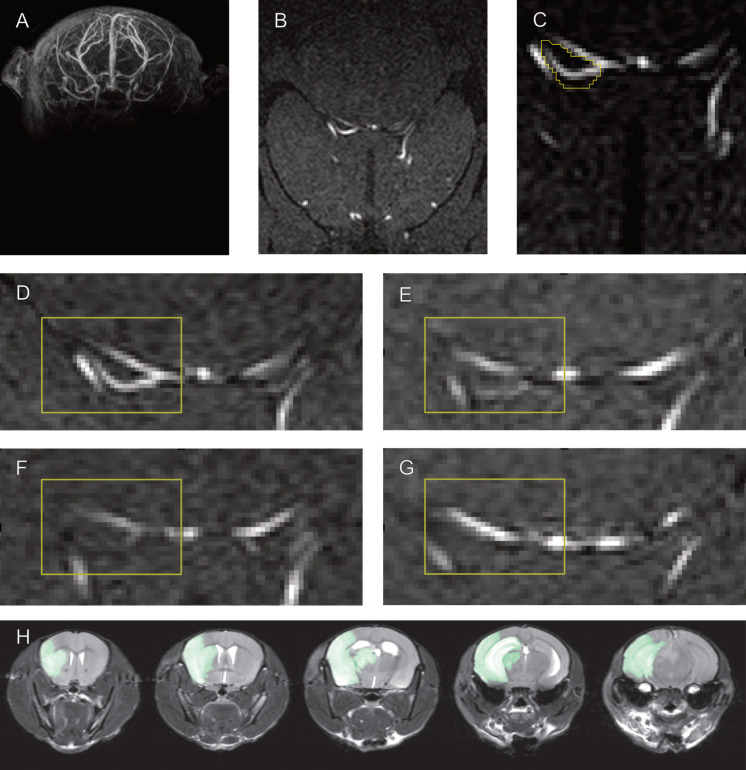
FIGURE 3.
Semiquantitative measurement of PcomA size and manual PcomA assessment. Whole brain TOF MRA recordings (A) were normalized to the Allen Brain atlas (B) to define a set of slices that contain the location of the PcomA in all animals. Semiquantitative measurements of PcomA patency were taken by assessing the maximum SNR in a manually delineated region of interest between the SCA and the PCA (C) in these slices. Examples of Allen atlas-normalized maximum intensity projections with large (D), medium (E), small (F) and absent (G) PcomA used for the training of raters to manually rate PcomA size. Examples of T2 MRI images used to obtain a mask of the ischemic lesion (H).

