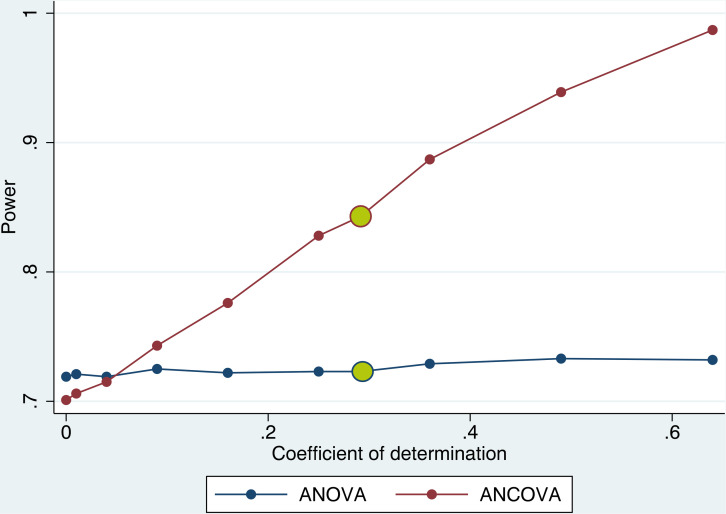
FIGURE 5.
Power to detect an effect of d = 1 with and without adjusting for a covariate. Adjusting for a single covariate in the outcome analysis (ANCOVA) increased the power to detect a true effect by up to 25% compared to no adjustment (ANOVA) depending on the magnitude of the correlation coefficient of covariate and outcome variable. Effect size d = 1, n = 14 per group, 1000 repetitions per condition. Coefficient of determination found in this study for the association of PcomA score and lesion size marked in yellow (r2 = 0.34).

