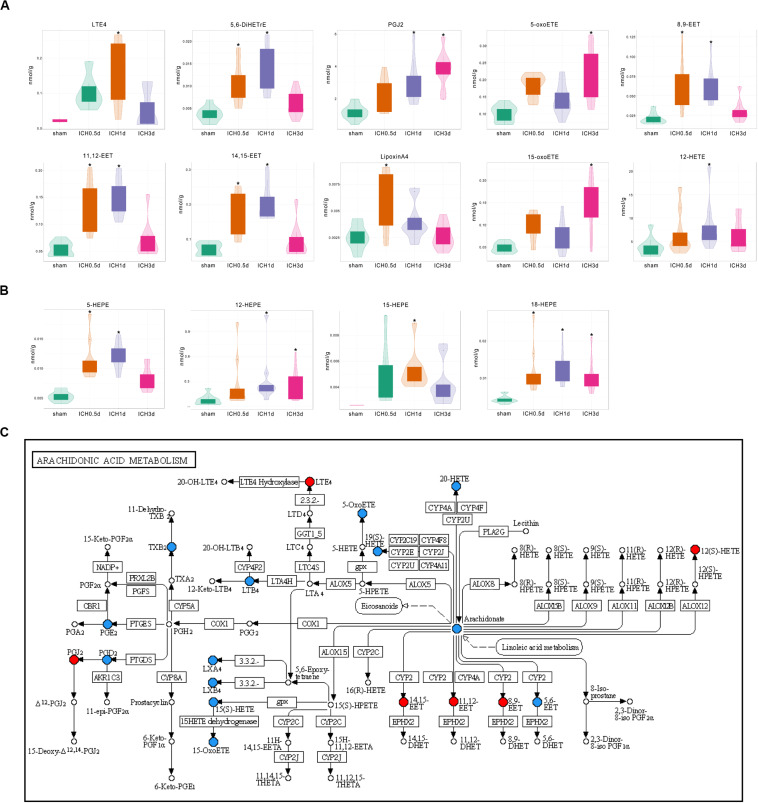
FIGURE 3.
Differential production of oxylpins in ICH. (A) Violin plots show the increase in oxylipins from AA in ICH (* vs Sham group, VIP ≥ 1, p < 0.05 using the Mann–Whitney U test and Log2FC ≥ 1, n = 10); (B) Violin plots show the increase in oxylipins from EPA in ICH (* vs Sham group, VIP ≥ 1 p < 0.05 using the Mann–Whitney U test and Log2FC ≥ 1, n = 10); (C) Kyoto Encyclopedia of Genes and Genomes (KEGG) pathway analysis of the identified differential oxylipins from AA at 1 day after ICH. Red indicates a significant increase in oxylipin; blue indicates that the oxylipin was detected but did not change significantly compared to the sham group and white indicates that the oxylipin was not quantitative in the brain.

