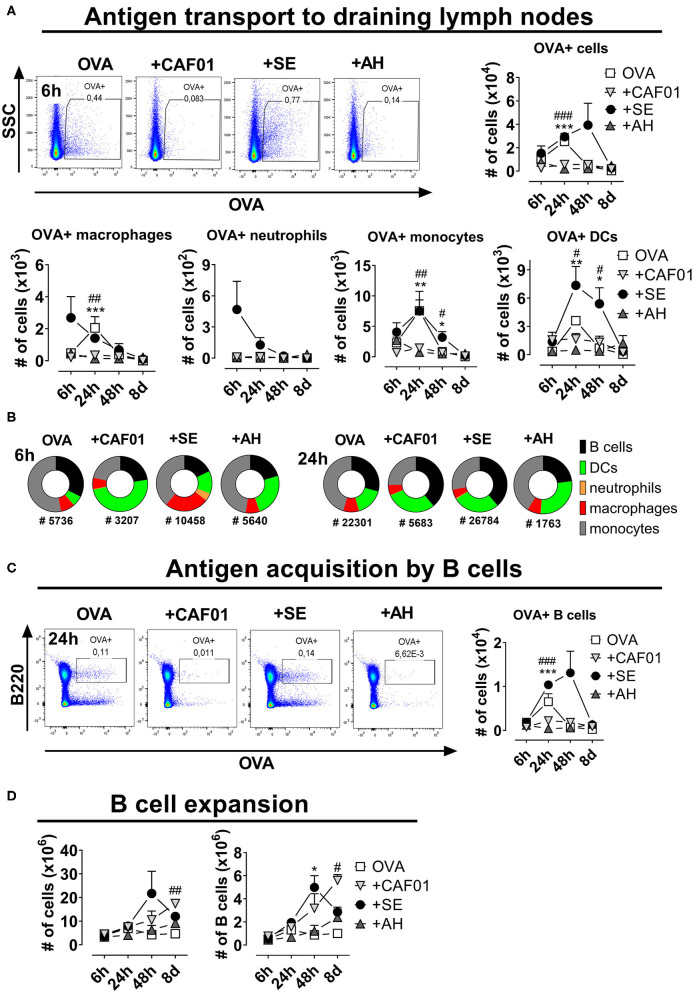
Figure 3.
Reduced antigen drainage to proximal lymph nodes in the presence of depot-inducing adjuvants. Mice were injected subcutaneously at the base of tail with ovalbumin (OVA) coupled to AF647 either alone or in the presence of the indicated adjuvant and the draining inguinal lymph nodes were collected at various time points thereafter. (A) Cells binding to OVA in the draining lymph nodes. Representative plots display the 6-h-time-point (upper panels). Lower panels display the numbers of cells within the indicated subsets binding to OVA. (B) Fraction of cells within the indicated subsets binding to OVA at 6 and 24 h post administration. The total numbers of OVA+ cells (surface-adsorbed or internalized) are displayed below the pies. (C) Representative plots of B cells binding to OVA at 24 h post injection (left panel) and summarized for the different time points (right panel). (D) The total cell number (left panel) and the percentage and numbers of B220+ B cells (right panels) at the indicated time points after injection. Each group consisted of 3 (naïve and antigen alone) or 4 (for each adjuvant) mice evaluated at each time point. Each point represents mean+ SEM. Statistically significant differences between the SE and AH groups are indicated by *, **, and *** whilst significant differences between the SE and CAF01 groups are indicated by #, ##, and ### (One-way ANOVA with Tukey's correction for multiple group comparison, using the SE group as reference and significance levels of p < 0.05, p < 0.01, and p < 0.001, respectively).

