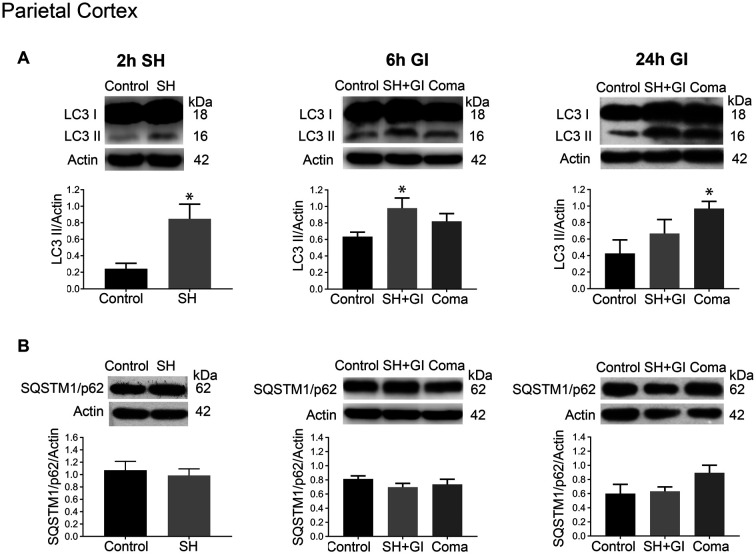
Figure 3.
Autophagy dynamics in the parietal cortex induced by severe hypoglycemia and the hypoglycemic coma at different times. Changes in (A) LC3-II/Actin and (B) SQSTM1/p62/Actin 2 h after SH (2 h SH) and 6 and 24 h after glucose infusion (6 h GI and 24 h GI). Bars represent mean ± SEM. Data were analyzed by one-way ANOVA followed by a Fisher’s post hoc test for multiple comparisons. For the 2 h group, a Student’s t-test was used for statistical analysis. *p ≤ 0.05 vs. control, n = 4–6 for the 2 and 24 h groups and n = 3 for the 6 h groups.

