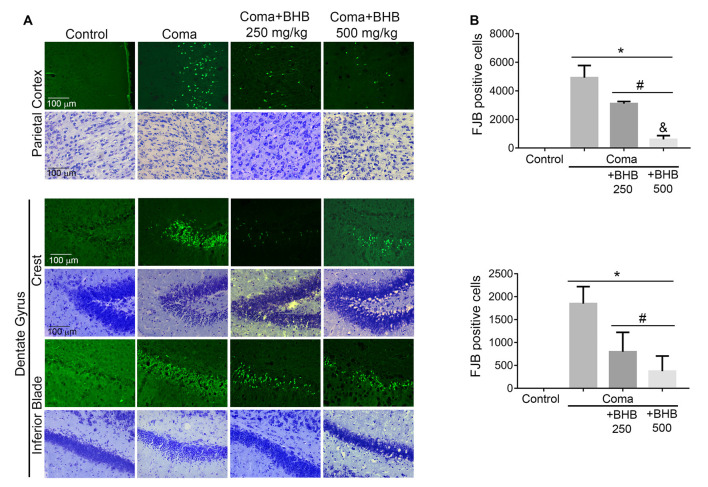
Figure 7.
Effect of D-BHB treatment on cell survival in the cortex and the hippocampus of rats exposed to the hypoglycemic coma. (A) Representative micrographs of FJB-positive cells and cresyl violet-stained sections of the parietal cortex and dentate gyrus. (B) The number of FJB-positive cells in control and hypoglycemic animals treated and non-treated with 250 or 500 mg/kg D-BHB in the parietal cortex and the dentate gyrus of the hippocampus. Data are expressed as mean ± SEM and were analyzed by one-way ANOVA followed by Fisher post hoc test for multiple comparisons. *p ≤ 0.05 vs. control, #p ≤ 0.05 vs. coma, &p ≤ 0.05 vs. 250 mg/kg, n = 6 control, n = 7 coma, n = 4 Coma + BHB.

