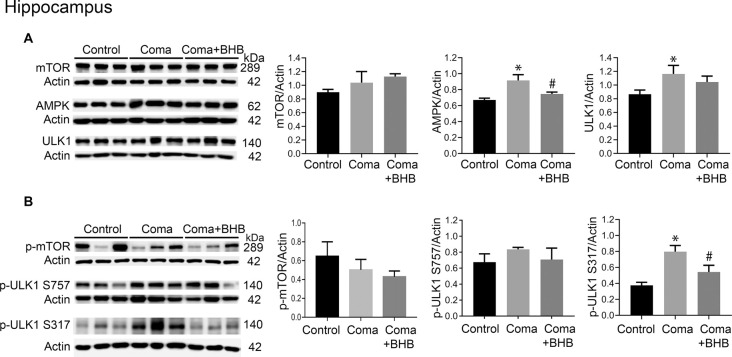
Figure 9.
mTOR and AMPK activity in the parietal cortex of animals treated and non-treated with D-BHB 24 h after the hypoglycemic coma. (A) Total levels of mTOR, AMPK, and ULK1. (B) Phosphorylation levels of mTOR S2448 and ULK1 S757 and ULK1 S317. Data are expressed as mean ± SEM. Statistical analysis was performed by one-way ANOVA followed by the Fisher post hoc test for multiple comparisons. *p ≤ 0.05 vs. control, #p ≤ 0.05 vs. to coma. n = 4–5 control, n = 5–6 coma, n = 4–5 Coma + BHB.

