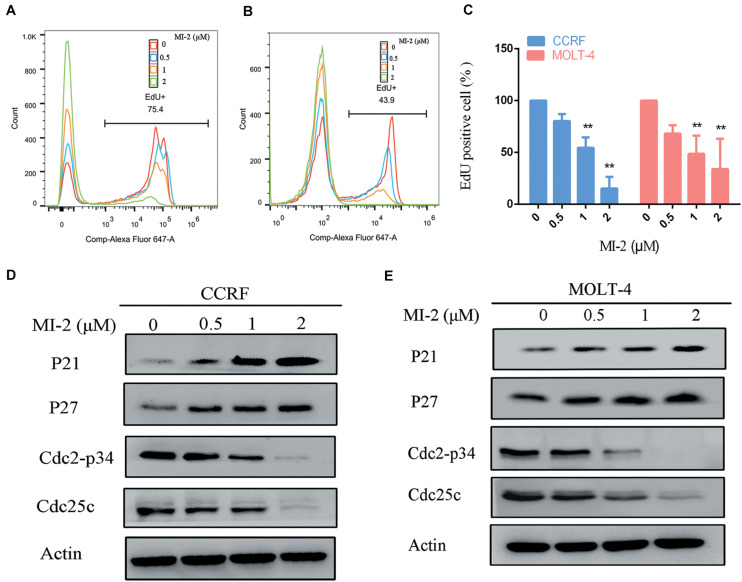
FIGURE 2.
MALT1 is associated with the proliferation of T-ALL cells. (A,B) The effect of MI-2 on proliferation was determined by FACS after MI-2 treatment. (C) The percentage of EdU positive cells was quantified in CCRF and MOLT-4. CCRF and MOLT-4 cells were treated for 12 h. (D,E) Expression of cell cycle related proteins was evaluated by western blot. **P < 0.01.

