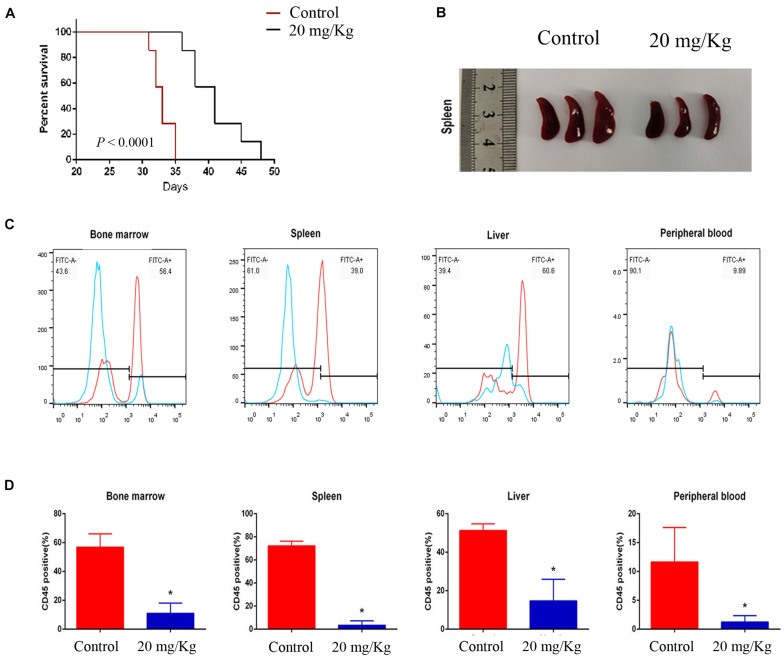
FIGURE 4.
MI-2 impaired leukemia progression in vivo. (A) Kaplan–Meier survival curves for recipient mice transplanted with CCRF leukemic cells are shown. Administration of vehicle or MI-2 (20 mg/kg per day for 20 days) began 2 days after transplantation. (B) Representative photographs of differences in spleen sizes are shown. (C) FACS analysis of the distribution of human CCRF cells in BM, PB, spleen, and liver of mice and stained with anti-human CD45. (D) The percentage of CD45 positive cells was quantified. *P < 0.05.

