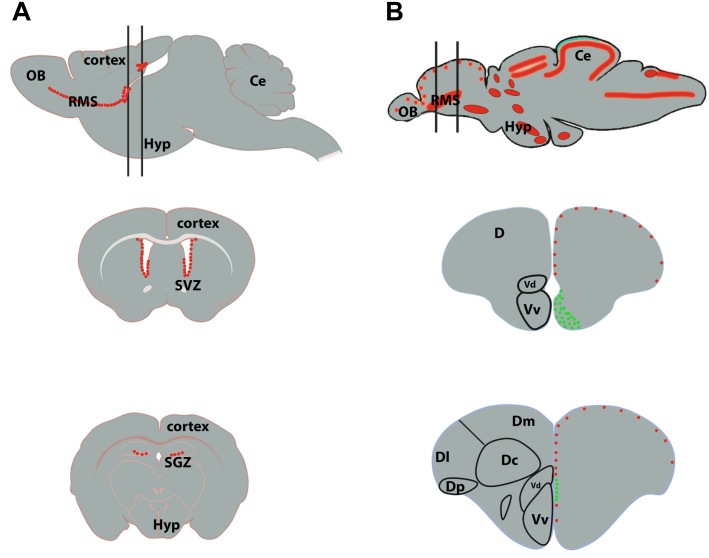
FIGURE 3.
Neurogenic niches in the brain of mammals and zebrafish. (A) Sagittal section of a rodent brain illustrating the main proliferative area shown by red dots (top scheme). The two black lines correspond to coronal sections through the subventricular zone (SVZ) of the lateral ventricles (middle scheme) and the subgranular zone (SGZ) of the dentate gyrus of the hippocampus (bottom scheme). The red dots correspond to proliferative cells. (B) Sagittal brain section of a zebrafish brain illustrating the main proliferative areas shown by red dots (top scheme). The two black lines correspond to coronal sections through the anterior part of the telencephalon, where the ventricular zone of the Vv-Vd is suggested to be the equivalent of the SVZ in mammals (middle scheme), and through the medial part of the telencephalon, where the Dl/Dp is suggested to be the homolog of the hippocampus in mammals (bottom scheme). In zebrafish, the red dots correspond to slow cycling progenitors (mainly RGCs, type 2) and the green ones to fast cycling progenitors (mainly neuroblasts, type 3). Ce, cerebellum; D, telencephalic dorsal area; OB, olfactory bulbs; Hyp, hypothalamus.

