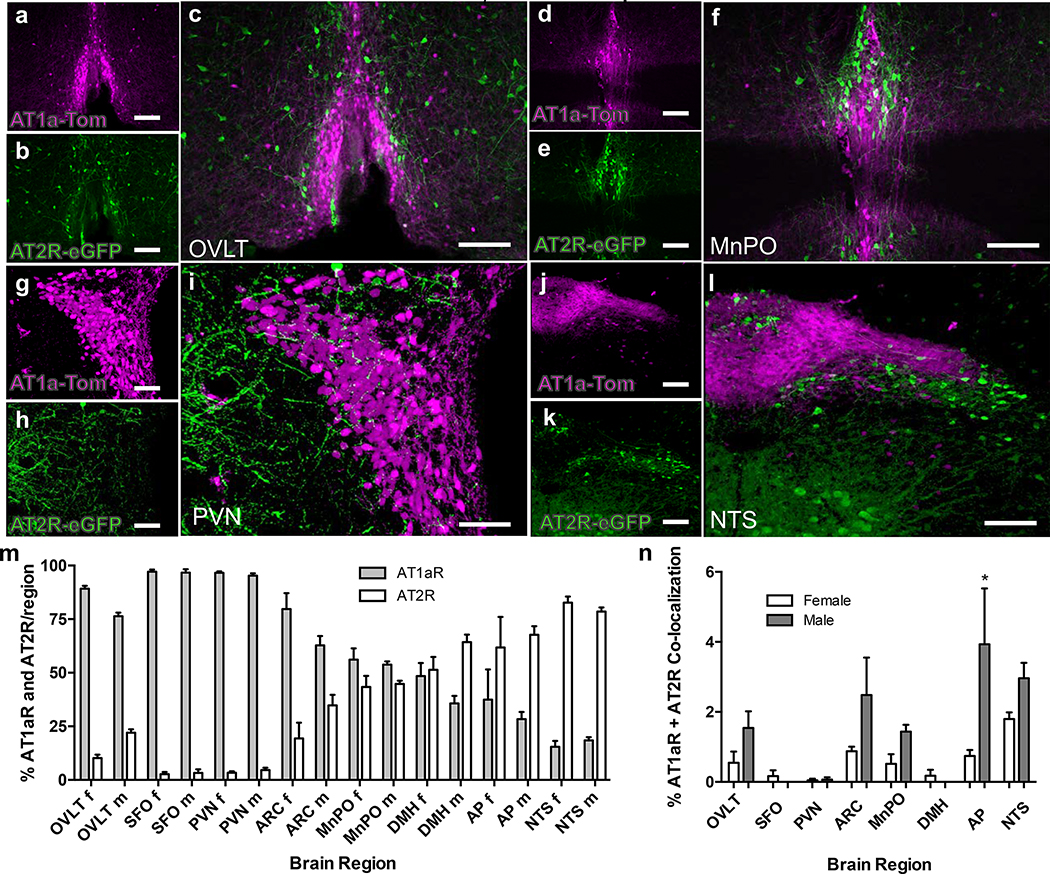
Figure 2. Relative localization of tdTomato- and eGFP fluorescence within the OVLT, MnPO, PVN and NTS of dual AT1aR-tdTomato/AT2R-eGFP reporter mice.
High magnification images through the OVLT (a, b), MnPO (d, e), PVN (g, h,) and NTS (j, k) of a male dual AT1aR-tdTomato/AT2R-eGFP reporter mouse showing AT1aR-tdTomato (magenta) and AT2R-eGFP (green). The respective merged images are shown in panels c (OVLT), f (MnPO), i (PVN) and l (NTS). Scale bars = 100 μm (a, b, d, e, g, h, j and k) and 50 μm (c, f, i, l). These images are representative of 8 mice. Bar graphs in panels m and n are analyses of the relative levels of AT1aR- and AT2R-positive cells within selected brain regions of female and male AT1aR-tdTomato/AT2R-eGFP reporter mice. (m) The percentage of AT1aR and AT2R within the regions indicated are plotted as means ± SEM for both female [f] and male [m] mice. OVLT = organum vasculosum of the lamina terminalis; SFO = subfornical organ; PVN = paraventricular Nucleus; ARC = arcuate nucleus; MnPO = median preoptic nucleus; DMH = dorsomedial hypothalamus; AP = area postrema; NTS = nucleus of the solitary tract. Data are from 4 female and 4 male AT1aR-tdTomato/AT2R-eGFP reporter mice. (n) The percentage of AT1aR and AT2R co-localization on the same cell within the selected regions are plotted as means ± SEM for both female and male mice. * P<0.05 vs. female AP.

