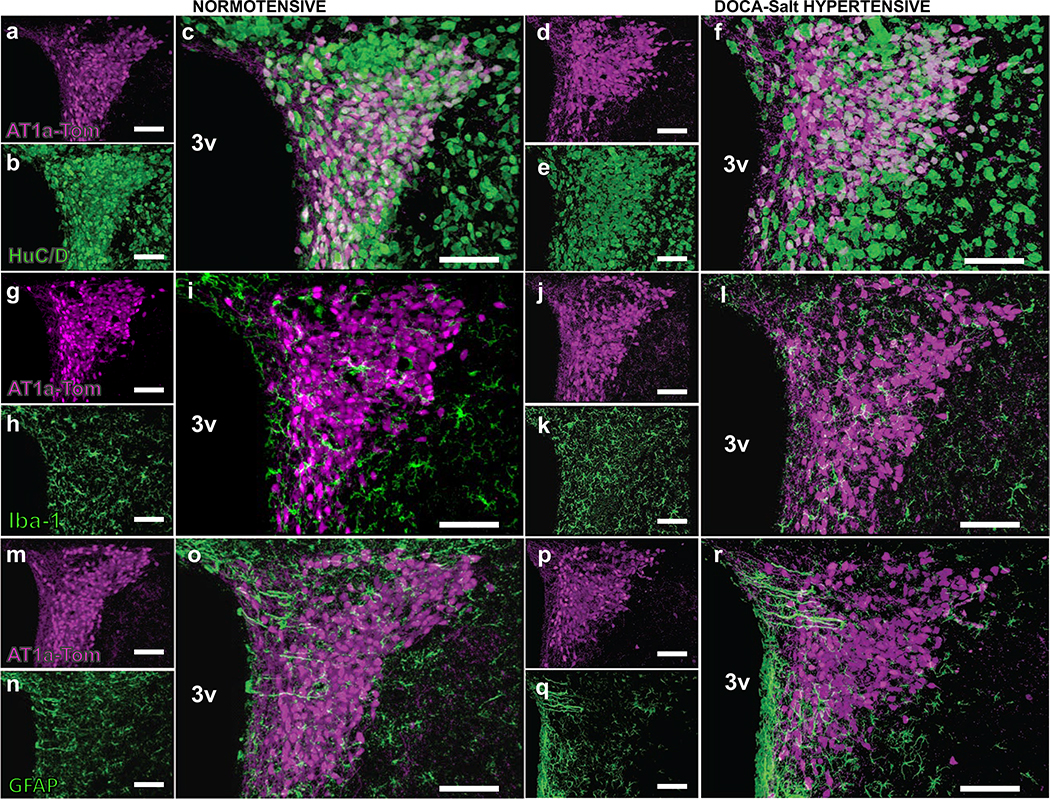
Figure 3. Cellular localization of AT1aR-positive cells within the PVN of normotensive - and DOCA-salt hypertensive mice.
Projection images from the PVN of male normotensive and DOCA-salt hypertensive mice showing the location of AT1aR-tdTomato fluorescence in relation to neurons, microglia and astrocytes. The location of tdTomato fluorescence (magenta) is illustrated in panels a, g and m (control normotensive mice) and d, j and p (DOCA-salt hypertensive mice). Panels b and e demonstrate HuC/D (neuron-specific marker; green) immunostaining of the same sections as shown in a and d, respectively. The merged images (c and f) illustrate that the tdTomato fluorescence is entirely associated with HuC/D. Panels h and k demonstrate Iba-1 (microglial marker; green) immunostaining of the same sections as shown in g and j, respectively, while panels n and q are GFAP (astrocyte marker; green) immunostaining of the same sections as shown in m and p. The merged images (i and l for Iba-1; o and r for GFAP) indicate that none of the tdTomato fluorescence is associated with microglia or astrocytes. 3V = 3rd cerebroventricle. These images are representative of 4 mice/group. Scale = 100 μm.

